Absorption and Photoluminescence Study of CdS Quantum Dots: The Role of Host Matrix and Nanocrystal Size and Density
- PDF / 435,920 Bytes
- 6 Pages / 420.48 x 639 pts Page_size
- 57 Downloads / 266 Views
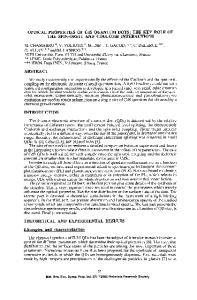
EXPERIMENTAL CdS-doped glass films were produced by a conventional rf-magnetron co-sputtering method using an Alcatel SCM650 apparatus. Details of the rf-sputtering deposition procedure have been previously published [5]. The NC size, as determined from the X-ray spectrum, was typically 5-1Onm for these samples, with a cubic structure resolved for larger NC. CP CdS NC were prepared by mixing at room temperature two equimolar (102 M) solutions of 1-thioglicerol cadmium salt and sodium sulfide. Both were dissolved in dimethylsulfoxide (DMSO). Two parts of the colloid solution of CdS NC were heated to 1700 C under nitrogen with an excess of cadmium ions. To remove the residual components, the resulting NC colloid solutions were precipitated using acetone and re-dissolved in fresh portions of DMSO. Thin solid films of matrix-free CdS nanocrystals on quartz, glass or Si substrates were then prepared by spin-coating using the colloid solutions. After drying, CdS NC's formed a random CP structure of nearly spherical particles separated by surface monolayers of thioglicerole. The NC size was 2-5nm, as determined from the absorption peak for different samples of this kind. Optical absorption spectra were measured using a double-beam Shimadzu model UV-3 101 PC. A Spex 1680 spectrometer was used for photoluminescence (PL) measurements in the spectral range 380 to 800nm. The PL spectra were obtained by exciting the samples with either an Ar+ laser (X=350nm and 457.9nm, output power 50mW and spot size 2mm) or a Xenon lamp (output power 0.5-2mW, depending on the wavelength, and spot area 10mm 2). The luminescence signal was recorded using a 1402 Spex double spectrometer equipped with an R943 Hamamatsu photomultiplier. The Xenon lamp was used also for the study of the PLE spectra. RESULTS AND DISCUSSION In the absorption spectra (Fig. 1), quantised e-h transitions are clearly seen only for the CP samples. We modelled these spectra in the following way. First, the energies of the confined eh pair states were determined. Within the effective mass approximation and assuming an infinitely high potential barrier at the interface, the dependence of these energies on the QD radius R is given by the simple formulas of ref. [6]. The rigorous calculation of the hole confinement energies is rather complicated because of the small spin-split energy in CdS [7], However, these values are small (few meV for QD larger then 2nm [7]) and were therefore ignored. We also took into account the bulk El transition, which presumably is little affected by the spatial confinement and responsible for the strong NC absorption below 300nm [2]. Given the transition energies, the QD susceptibility X can be defined [8] and its polarisability calculated according to:
a=
{-3--)
2 )+(,
)41)+22)
(1)
where E() and E(2) are the high-frequency dielectric constants of the QD and matrix, respectively. In the low QD concentration limit, this quantity (averaged over the sizes) gives the optical response of a QD ensemble. However, for dense composites like the CP NC
Data Loading...