Al-Ni (aluminum-nickel)
- PDF / 45,927 Bytes
- 1 Pages / 612 x 792 pts (letter) Page_size
- 95 Downloads / 447 Views
Section III: Supplemental Literature Review
Al-Ni (Aluminum-Nickel) H. Okamoto
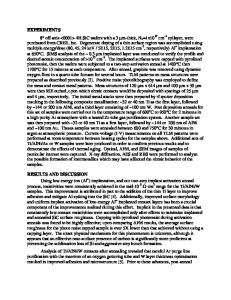
The Al-Ni phase diagram in [Massalski2] was adopted from [1991Nas]. Solid lines in Fig. 1 show the Al-Ni phase diagram modified by [1993Oka] based on the work of [1990Jia] for the boundaries of AlNi + AlNi3 and AlNi3 + (Ni) two-phase fields. [2003Ma] reexamined the AlNi3 / AlNi3 + (Ni) phase boundary in detail by means of aging treatments at 1000 to 1200 °C and dissolution experiments at 600 to 900 °C. The result is shown with a dashed line in Fig. 1. For comparison, the AlNi3 phase field assessed by [1991Nas] is shown with dotted lines in Fig. 1. If the Ni-rich boundary of AlNi3 is as reported by [2003Ma], the Al-rich boundary may have to be modified substantially so that it meets the Ni-rich boundary at its peritectic decomposition
temperature on heating. Further investigation is needed with regard to this point. References 1990Jia: C.C. Jia: Ph.D. Thesis, Tohoku University, 1990. 1991Nas: P. Nash, M.F. Singleton, and J.L. Murray: “Al-Ni (Aluminum-Nickel),” Phase Diagrams of Binary Nickel Alloys, P. Nash, ed., ASM International, Materials Park, OH, 1991, pp. 3-11. 1993Oka: H. Okamoto: “Al-Ni (Aluminum-Nickel),” J. Phase Equilibria, 1993, 14(2), pp. 257-59. 2003Ma: Y. Ma and A.J. Ardell: “The (␥ + ␥⬘)/␥⬘ Phase Boundary in the Ni-Al Phase Diagram from 600 to 1200 ºC,” Z. Metallkd., 2003, 94(9), pp. 972-75.
Fig. 1 Al-Ni phase diagram
394
Journal of Phase Equilibria and Diffusion Vol. 25 No. 4 2004
Data Loading...