Aspects of Tip Shape Characterization for Nanoindentation of Compliant Materials
- PDF / 373,494 Bytes
- 6 Pages / 612 x 792 pts (letter) Page_size
- 22 Downloads / 368 Views
R9.2.1
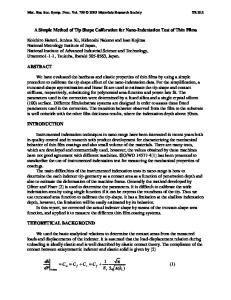
Aspects of Tip Shape Characterization for Nanoindentation of Compliant Materials Mark R. VanLandingham, Thomas F. Juliano and Matthew J. Hagon U. S. Army Research Laboratory, Weapons and Materials Research Directorate, Aberdeen Proving Ground, MD 21005-5069 ABSTRACT The application of nanoindentation methods to compliant materials, such as polymeric and biological materials, often requires the use of instrumentation designed with enhanced force sensitivity, which limits its maximum force level. Because tip geometry is normally characterized using indentation of fused silica, the maximum contact depths achieved by lowforce instruments during this calibration are often less than 300 nm. However, penetration into more compliant materials can be several micrometers or more. Extrapolation of tip shape data from fused silica indentation can lead to significant uncertainties in the indentation measurements for compliant materials. In this paper, atomic force microscopy (AFM) is used to provide tip shape information for a Berkovich tip and a series of conical tips. Use of AFM allows a larger range of depth to be calibrated and provides three-dimensional tip information. INTRODUCTION The tip shape function for indentation studies is determined by measuring the projected contact area, A, of the indentation tip as a function of contact depth, hc. In Fig. 1, the indentation geometry for an ideal conical indenter is illustrated in two dimensions along with an indentation force-displacement curve. At a given force, P, A is a function of the distance, hc, from the tip apex, where A = πa2 and a is the contact radius (see Fig. 1). Using a reference material of known elastic modulus, E, measurements of the maximum penetration depth, hmax, the corresponding maximum force, Pmax, and the contact stiffness, S, can be used to calculate A and hc for a set of indentation experiments [1]. Alternatively, a small harmonic oscillation can be superposed over the quasi-static loading ramp. Using an appropriate dynamic model of the system, the measured response can be used to calculate values of S, A and hc as a function of displacement, h [2]. In either case, a tip shape function, A(hc), is determined by fitting the A vs. hc data using a multiterm polynomial function of the form: A(hc ) = B0 hc2 + B1 hc + B2 hc 2 + B2 hc 4 + K 1
1
Surface Profile at Maximum Load
hc
hmax
Load, P
LOADING
Pmax Indenter Initial Surface
a
(1)
UNLOADING
Pmax S hmax
Displacement, h Figure 1. Schematic illustrations of the indentation geometry at maximum force for an ideal conical indenter (left) and an indentation force-displacement curve (right).
R9.2.2
In Eq. (1), Bn are constants determined by curve fitting [1]. For an ideal Berkovich pyramidal probe of internal angle, β = 65.2725º, between the probe axis and each face, the area function is A(hc) = B0hc2, where B0 = 3 3 tan 2 β = 24.5. Additional terms in Eq. (1) are used to account for further deviations from ideal geometry, such as blunting of the probe apex. Depending on how these additional
Data Loading...