Binary and Ternary Alkali Graphite Intercalation Compounds: In-Situ X-Ray Study of Elastic and Electrostatic Effects on
- PDF / 334,878 Bytes
- 6 Pages / 420.48 x 639 pts Page_size
- 29 Downloads / 977 Views
Mat. Res. Soc. Sysp. Proc. Vol. 20 (1983) QElsevier Science Publishing Co., Inc.
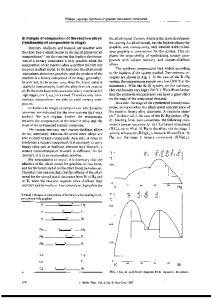
284 x-ray furnace. (00k) scans were taken with MoK. radiation, monochromated either by the graphite (002) or, for higher resolution, the silicon (111) reflection. RESULTS 1. Stage transformations in KCn We have investigated [2] the transformation of the stages 1 2, 4 -+5, and 6 -+7 at potassium graphite intercalation compounds. X-ray (00k) scans were taken along isobars under thermo-
2o (degrees)
dynamic equilibrium conditions. In
0 . .2 4
I
stage 1 . G:272.80C T t Q.0hI
4.c 3.-
6
lkeeping
stage 1+2 TG=276.8 0 C
t =4.6 h
reflection intensities. However, the
OAOi *
1.0-
•2
00
0oc-
,the
30
widths and the structure factors of the coexisting stages are the same as in the pure stage compounds just below (Fig. la) or above (Fig. id)
2.0
.0-
•
iI
i[
_-_
00
30 o
:, _.__
the stage transformation. '
stage 1+2 TG=276.8 0 C
t =47.5 h .
0
_
one empty to three filled, one empty, etc. Depending on the rate of transformation, non-pure intermediate stages should be observable either
as shifts of reflections from their stage 1 to their stage 2 Bragg -
0O
angles, or as broadening of the pure stage reflections. Since neither possibility was seen, we conclude
stage 2 TG=278.8oC
60
If non-pure
stages exist, then the transformation 41 (- 2 should proceed through transitions to 'successively lower'
non-pure stages, for instance from say four interlayer spaces filled,
20-
.0
the time evolution of the stages by the sample temperature TG fixed. In all cases the transition regions were characterized by the coexistence of two distinct pure stages with well preserved long range order. Fig. 1 shows a sequence of (00Z) scans from the stage 1 to stage transformation. In the middle of transition region (Figures lb and ic), the intensity of the stage 2 reflections is increasing slowly at the expense of stage 1 (OOZ) -
G02 2.0
4.0
the transition regions we have studied
t =185 h
°
that non-pure stages do not exist
003 002
40
2
0.0 -in
001 -OZ
..
for the heavy alkali - metal compounds. A word of precaution, however, is in order here. Intercalated HOPO samples, as used in these experiments, are actually composed of numerous %crystallites. • Therefore, we 'see' the (00k) Bragg - reflections
Fig. 1. Sequence of (00k) reflections during stage transformation: TG = sample temperature and TK= 208'C constant K temperature.
the statistical average of all the crystallites. But only a few of them may be changing stage at any one time, and their passage through
285
Stage 2 (003)
Stage I (002) TG = 290-C T = 196"C
"Z60 W
U) N N
1 40o
,
C
= 20-0 ,_,
Fig.
2.
.;
" 0
I
I
14.0
14.2
I
I
14.4 14.6 28 (Degrees)
I
I
14.8
15.0
I
Single crystal (000) scan during the stage 1 to stage 2 transition,
various steps of completion may not have been observable. To elucidate this point, we have repeated the in-situ investigation of the stage 1 (-)2 transformation on a single crystal. A Laue picture of the single crys
Data Loading...