Creep-fatigue life prediction in terms of nucleation and growth of fatigue crack and creep cavities
- PDF / 1,332,250 Bytes
- 7 Pages / 613 x 788.28 pts Page_size
- 37 Downloads / 443 Views
1.5
5
........
O
(b)
(a)
9 ........
~
Cu - R
4
R
I ........
Cu-5%Zn - R
4
3
1
1
.......
3
R
. . . . . . . I 'T . . . . .
4
1
J
3
R
'R
R I
.5
.5
A
1
0 ........ 3
' .......
0 45 (a)
0
........
1
0 90
I ........
.......
3
........
Cu P
0 45
0
90
J
' ' ( e')' ' '
'lJ
' ' ''
I I I,,11
lllll
(d)
.
iiii
1
3
........
0
R
3
r,,, ....
e 45 ( d ) ........
2
R i
0
e 45 (e)
I ........
3
.......
90
0 45
90
1.5
I
90
.......
2
........
0
~
~ .......
0 45 (g)
~
90
i
'
'
.5
I I
i I
i f
]
I I
I I
I I
I t
0 0 45 90 Fig. 13--Comparison of CMTP predictions (/72 yield function) and experimental data (e) for various metals displaying the texture components indicated. (--4--) Taylorassumption;( t3 ) KochendSrfermodel. (a) Copper with a strong {100}(001) texture/3 (b) Iron single crystal sheet: {100}(011) orientation.19 (c) Cold rolled and annealed low C steel: {100}(012) orientation.35 (d) Iron single crystal sheet: {l12}(1T0) orientation.'9 (e) Cold rolled and annealedlow C steel: {411}(14g) orientation.35
with experimentally determined R(O) curves. These are displayed in Figure 16, where the work of Ito et al. 27 is displayed, and in Figure 17, where the results of Parni~re 19are shown. It is evident from Figure 16(c) that the sharp R-value variation is accurately predicted. However, in the case of the other steels, the CMTP predictions underestimate the amplitudes of the R(O) curves, although the positions of the R extrema are well reproduced. The relative inability of the present yield functions to reproduce the full extent of the R-variations can be readily explained by their smooth nature I 1 4 - - VOLUME 19A, JANUARY 1988
i
I
. . . . . . .
i
i
90
~ .......
Cu-20%Zn - F 2
R
0
3
i
e 45 ( f )
R
0
........
0
' ........
0 45 (h) 9o
0
' .......
0
' ........
04s
(i)
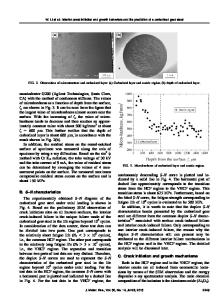
Fig. 1 4 - - R ( 0 ) curves for the f o l l o w i n g rolled sheets: (a) C u - R , (b) 5 pet Z n - R , (c) C u - 2 0 pet Z n - R , (d) Cu-P, (e) Cu-5 pet Zn-P, ( f ) 20 pet Zn-P, (g) Cu-F, (h) Cu-5 pet Zn-F, and (i) C u - 2 0 pet Z n - E E x p e r i m e n t a l R - v a l u e s taken f r o m Ref. 18. ( o o ) Fj (n = m = 1.5) a n d ( tJ [] ) F2 criteria used with the K o c h e n d 6 r f e r model. texture d a t a used are those reported in Ref. 18.
I I
90
, ........
I
. . . . . . .
0
Cu-5%Zn - F
R
0
0
90
2
45
.......
,
(c)
Cu-20%Zn - P
I
Ca 9F
.5
0
O 45
3
R ~
0
1
0
~ .......
0
90
0 45
' I '' 1
R
0 ................ 90
i,,,rq
R
1.5
' ........ 45 ( b )
Cu-5%Zn - P
9
,
0
0
90 CuCu(e) 2.6, The
(see Figures 7 through 10), which leads to reduced fluctuations in strain rate through the normality rule. By contrast, in crystallographic calculations,12 the R-value variations are frequently too pronounced. The results published by Stephens, 2~ Kallend and Davies, 28'29and Svensson 3~ on yield stress measurements pertaining to cold rolled and annealed sheet are shown in Figures 18 through 20, respectively. The CMTP calculatio
Data Loading...