Detection of time delay using cross-correlation for aortic pulse wave velocity evaluation
- PDF / 513,807 Bytes
- 2 Pages / 610 x 792 pts Page_size
- 1 Downloads / 321 Views
BioMed Central
Open Access
Poster presentation
Detection of time delay using cross-correlation for aortic pulse wave velocity evaluation Yi Wang*1, Edwin Estrada1 and Nathaniel Reichek1,2 Address: 1St. Francis Hospital, Roslyn, NY, USA and 2Stony Brook University, Stony Brook, NY, USA * Corresponding author
from 13th Annual SCMR Scientific Sessions Phoenix, AZ, USA. 21-24 January 2010 Published: 21 January 2010 Journal of Cardiovascular Magnetic Resonance 2010, 12(Suppl 1):P144
doi:10.1186/1532-429X-12-S1-P144
Abstracts of the 13th Annual SCMR Scientific Sessions - 2010
Meeting abstracts - A single PDF containing all abstracts in this Supplement is available here. http://www.biomedcentral.com/content/files/pdf/1532-429X-11-S1-infoThis abstract is available from: http://jcmr-online.com/content/12/S1/P144 © 2010 Wang et al; licensee BioMed Central Ltd.
Introduction Aortic compliance (AC) can be evaluated noninvasively and its reduction with age in normals has been demonstrated with both MRI and Doppler echo methods. Aortic pulse wave velocity (PWV), a measurement of the flow pulse traveling along aorta as a surrogate of AC, can be assessed using a single breath-hold phase contrast (PC) imaging technique. Accurate determination of the time delay (Δt) between flows in ascending and descending aortic regions is critical in PWV assessment.
between them. The Δt was the time shift at the maximal correlation. We then calculated PWV = ΔD/Δt and aortic compliance as AC = 1/(p*PWV2), where blood density p = 1057 kg/ m3. Linear regression was used to determine the relationships between AC and age.
Purpose We studied aortic compliance using a cross correlation approach for time delay detection and evaluated the aortic compliance results correlated with age in normal volunteers.
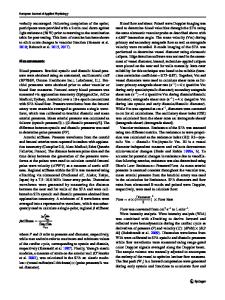
Methods A total of 120 healthy volunteers with informed consent (age: 59.5 ± 13.9) were screened to exclude hypertension, obesity and cardiovascular disease. Using the 'candy cane' view of aorta, an axial plane through the ascending and descending aorta at the pulmonary artery level was prescribed and a through-plane velocity encoded PC cine imaging was acquired on a 1.5 T MRI scanner. The distance traveled by the aortic pulse wave, ΔD, was determined as the distance along the central line between ascending and descending aorta in the 'candy cane' image. For Δt assessment, cross correlation algorithm was used: The cross correlations between the first halves (all flow points before the peak) of ascending and descending aortic flow curves was calculated by varying the relative time
Figure 1
Page 1 of 2 (page number not for citation purposes)
Journal of Cardiovascular Magnetic Resonance 2010, 12(Suppl 1):P144
http://jcmr-online.com/content/12/S1/P144
Table 1: The Correlation between aortic compliance and age, in total and different genders
Prob > |r| under H0: Rho = 0
Total (n = 120)
Male (n = 55)
Female (n = 65)
r p
-0.56
Data Loading...