Determination of the solidification curve of a RENE N4 superalloy
- PDF / 141,136 Bytes
- 2 Pages / 612 x 792 pts (letter) Page_size
- 36 Downloads / 421 Views
THE knowledge of solidification curves is essential for the control of casting processes. Efforts have been conducted in calculating the solidification curves by using thermodynamic models.[1,2,3] However, for a nine-component alloy such as the RENE* N4 Ni-based superalloy,[4] a com*RENE is a trademark of General Electric Company, Fairfield, CT.
plete thermodynamic description of the system involves too much work and is almost impossible. The nominal composition of the superalloy is Ni-9 wt pct Cr-7.5 wt pct Co6 wt pct W-4.2 wt pct Ti-4 wt pct Ta-3.7 wt pct Al-1.6 wt pct Mo-0.5 wt pct Nb. Chen et al.[4] proposed a methodology to estimate the free energies of the related liquid and solid phases from the free energies of the constituent binary systems, and then they used the theoretical phase relationships and the Scheil model to calculate the solidification curves of the superalloy. The results were successful; however, the evaluation of the free energies of the related phases of the 36 binary systems was still an enormous amount of work. A different approach to the determination of the solidification curve has been proposed.[5,6,7] This method has been tested for various aluminum alloys and has been demonstrated to be successful. This method uses differential thermal analysis (DTA) to determine the cooling curve of the alloy, and then the solidification curve is derived from the experimentally determined cooling curve based on a heat transfer model of the DTA. This DTA method was used in this study to investigate the solidification curve of the RENE N4 superalloy. Gray’s[8] description of the DTA cell was adopted in this study. The following equation is derived from the thermal balance equation of the DTA cells with several assumptions: the heat of solidification of the specimen is constant, the heat transfer resistivities are identical for the reference cell and the sample cell, and the temperatures are uniform inside the cells. (Ts 2 Tr) 5 RH
df a d(Ts 2 Tr) 1 RC dt dt
[1]
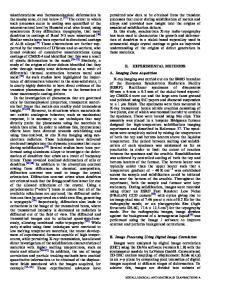
The temperature differences between the sample cell and the reference cell, (Ts 2 Tr), are determined from the DTA cooling curves, and RH and RC are two system parameters. The solidification curve, which is the fraction solid fa vs the solidification time t, can then be calculated from the cooling curve by using Eq. [1]. A detailed description of the model has been discussed in previous publications.[5,7,8] The cooling curve of the superalloy determined by using DTA is shown in Figure 1. The cooling rate was 40 K/min,
SINN-WEN CHEN, Associate Professor, and SHIH-CHANG JENG, Graduate Student, are with the Department of Chemical Engineering, National Tsing-Hua University, Taiwan 30043, Republic of China. Manuscript submitted May 13, 1996. METALLURGICAL AND MATERIALS TRANSACTIONS A
Fig. 1—The cooling curve of the Rene N4 superalloy determined by using DTA at 40 K/min cooling rate.
Fig. 2—The solidification curve of the Rene N4 superalloy determined in this study superimposed with those calculated by Chen et al.[4] using Muggianu approximati
Data Loading...