Effects of Impurities on the Crystallization and Grain Growth of Polycrystalline Si Films
- PDF / 1,085,379 Bytes
- 6 Pages / 414.72 x 648 pts Page_size
- 31 Downloads / 339 Views
Cooling Jacket
Quartz Tube
deposition reached 8 X 10' Torr using turbo
Load Lock
Wafer
molecular pump. The base pressure during deposition was controlled by the pumping method (i.e., turbo pumping vs. mechanical
.'
ve
pumping) and the throttle valve. Here, we
Lamp Heater
QMS
define the base pressure as the vacuum pressure at the throttle valve position which is set for film deposition. The base pressures turbo pumping and mechanical pumping alone were approximately 10-1 Torr and 10 Torr, respectively. 1500OA-thick Si films were deposited onto thermally oxidized Si wafers using Sill, or Si2H- gas at various deposition
RP
TMP
iS
QM
"with
RP
Quadrupole mass spectmmeter
TM P Turbo molecular pump
SiH,
Roughing pump
RF
He
temperatures. The crystalline structures of as-deposited films were analyzed by XRD. were amorphously deposited Fig. 1. Schematic diagram of high vacuum chemical Those subsequently annealed at 540 *C- 600°C in vapor deposition system. SIH,
N2
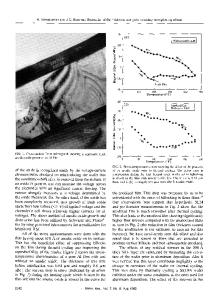
N, ambient for SPC. The crystallinity and grain structure of the poly-Si films were studied by XRD, TEM and Raman spectroscopy. N-channel TFTs were fabricated employing SPC on Si films deposited at various base pressures to examine the effects of base pressure on the device performance. RESULTS AND DISCUSSION Deposition of Si films Deposition rates are plotted against deposition temperatures at 0.1 and 0.25 Torr deposition pressures for Sil-L and Si,H, gases, respectively, as shown in Fig.2. Both SiI-, and Si2I-l deposition
104
Temperature (°C )
,4
450 0C 5500C 0.1 Torr iPD= 0.1 Torr: SiH 4* 'Sil4H
650 0C
PD=0.
SiAH 0 .:
E
E
Torr,
[ 0l•
*
PD=0.1 Torr PA=0.25 Torr
PB=10"3 Torr
o
PD=0.1 Torr PD=0.25 Torr
"0-103
0.1 Torr. Po=0.25 Torrt PD=
103 [3-
2 5
P B=10"s Torr
A
a) a-10
• 102
0€a) -10 2
0
0. 101 \0
100
I I
1.1
P
i
.
.
.
.
1.4 1.2 1.3 1/T x 1000 (K-')
.
.
,
l
•
m
,
,
•
!
,
z
,
1.05 1.10 1.15 1.20 1.25 1.30 1.35 1) 1/T x 1000 (K7
1.5
Fig. 3. Deposition rate as a function of reciprocal deposition temperature for various base pressures.
Fig. 2. Deposition rate as a function of reciprocal temperature. 386
show similar activation energy values of 36-37 Kcal, while the Si2I- deposition shows 10 times higher deposition rates than those of Sill. For the different base pressures investigated, the deposition rate was kept constant by adjusting the gas flow rates, as shown in Fig. 3, to eliminate any effects due to changing deposition rates. The deposition temperature of the amorphous/crystalline Si transition was determined by XRD studies of the changes in (11) diffraction peaks. As deposition temperature increases, films show the (111) crystalline peaks, and their intensities increase to the saturation value, as shown in Fig. 4. These changes are in accord with the transitions of amorphous Si--amorphous/crystalline mixtures -- crystalline Si. It can be seen that the base pressure (PB) affects the transition temperature. For PB of 10:- Torr, transition starts at 490*(C and is completed at 580
Data Loading...