Experimental investigation and thermodynamic modeling of the Cr-Ni-Si system
- PDF / 346,369 Bytes
- 9 Pages / 612 x 792 pts (letter) Page_size
- 55 Downloads / 364 Views
I. INTRODUCTION
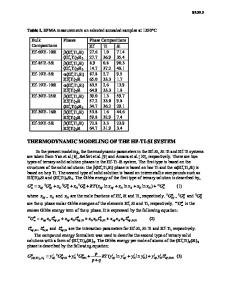
A THERMODYNAMIC description for the Cr-Ni-Si system is desired within our research program[1–4] aiming at establishing the phase diagrams for the C-Cr-Ni-Si-Ti quinary system and its constituent ternaries and quaternaries by using both experiment and thermodynamic modeling. Information about the phase equilibria and thermodynamic properties in the C-Cr-Ni-Si-Ti system is of fundamental importance in many applications such as joining of SiC with Ti modified Cr-Ni brazes,[5] ohmic contacts in integrated circuits,[6] and self-propagating high-temperature synthesis.[7] There have been several experimental determinations of the phase equilibria in the Cr-Ni-Si system since the early work.[8] By means of x-ray diffraction (XRD) and optical microscopy, Guard and Smith[8] constructed the isothermal section at 1050 ⬚C in the region Ni-CrNi-NiSi. A ternary compound with the approximate composition Cr2Ni3Si identified by them was later designated as the ternary compound (Cr3Ni5Si2).[9–13] Using XRD, Aronsson and Lundstro¨m[14] noted that a ternary phase occurs in the Cr-Ni-Si system at relatively low Si concentrations, even though no phase is known to exist in the binary Cr-Ni system. The range of phase at 1175 ⬚C was determined by Gupta et al.[15] using the XRD technique. Based on XRD measurement, Burger et al.[16] found that at 900 ⬚C CrSi dissolves about 40 mole pct NiSi, whereas the solubility of CrSi in NiSi is negligible. Following the same method, Wittmann et al.[17] reported that neither NiSi2 in CrSi2 nor CrSi2 in NiSi2 shows any noticeable solubility. At 900 ⬚C, the solubility of Cr in Ni3Si was determined to be 1.5 at. pct by Li et al.[18] using electron probe microanalysis (EPMA) technique. The phase relationships at 800 ⬚C in the composition region of 5 to 25 at. pct Si and 5 to 30 at. pct Ni were measured by Gladyshevskii et al.[10] using the XRD technique. These authors found two ternary phases, and , which have an approximate formula Cr6Ni2.8Si1.2 and a homogeneity region 46 to 52 at. pct Ni JULIUS C. SCHUSTER, Professor, and YONG DU, Postdoctoral Fellow, are with Institute of Physical Chemistry, University of Vienna, A-1090 Wien, Austria. Manuscript submitted November 4, 1999. METALLURGICAL AND MATERIALS TRANSACTIONS A
and 18 to 22 at. pct Si, respectively. The subsequent work by Gladyshevskii and Borusevich[11] focused on the measurement of the entire isothermal section at 850 ⬚C. In addition to the compounds and , Gladyshevskii and Borusevich observed three new compounds, 1, 2, and T. The T phase is not included in the present modeling since neither the later researchers[12,13] nor our own experimental data could confirm its existence. The key contribution to the measurement of the Cr-Ni-Si phase diagram is the extensive work by Kodentsov et al.[12] and Ceccone et al.,[13] who determined the entire isothermal sections at 900 ⬚C,[12] 1050 ⬚C,[13] and 1125 ⬚C[13] by using XRD and EPMA techniques. These investigators observed four ternary compounds, , , 1, and 2. The phase
Data Loading...