Flow Stress, Flow Curve
- PDF / 139,452 Bytes
- 5 Pages / 504.567 x 720 pts Page_size
- 66 Downloads / 574 Views
Flow Stress, Flow Curve Alan Bramley Mechanical Engineering, University of Bath, Bath, UK
Definition
essential prerequisite and for this purpose the use of empirical stress–strain curves and constitutive relations are used. The flow curve is best explained by considering a simple uniaxial tensile test on a typical piece of metallic material, mild steel at room temperature. This is depicted in Fig. 1. A typical force–extension curve from such a test is shown in Fig. 2.
Relationship between true stress and strain for a given material undergoing plastic deformation.
The Elastic Region and Yielding Related Terms Stress–strain curves; work/strain hardening curve
Theory and Application Introduction/Context In metal-forming technology a major parameter is the load or force required to perform the operation. This is dependent on the geometrical configuration, friction at the tool–workpiece interface, and the mechanical resistance to plastic flow of the workpiece material and in turn determines the required force and energy capacity of the machine tool being used. This mechanical resistance of the workpiece material is defined by its flow curve which can be established independently by testing. Thus, in modelling of a forming process, the flow curve of the workpiece material is an
The initial part of the curve, OA in Fig. 1, is the characteristic linear-elastic behavior of the material, i.e., the extension that occurs is fully reversible and the relationship between the force and the extension is linear. At an atomic level the bonds between the atoms of the crystal structure are just flexing. The extension in this region is however very small and can only be measured using special extensometers. This linearity ceases at point A and the material starts to behave irreversibly, i.e., permanent or plastic deformation occurs. This phenomenon is known as yielding. In this region the atoms take up new position relative to each other by the mechanism of dislocation activation. After initial yielding the load continues to rise, reaching a peak at point B, thereafter falling until the specimen fractures at point C. This is depicted in Fig. 3.
# CIRP 2016 The International Academy for Production Engineering et al. (eds.), CIRP Encyclopedia of Production Engineering, DOI 10.1007/978-3-642-35950-7_16704-3
2
Flow Stress, Flow Curve
Diameter d0 Area A0 F
F
l0 Gauge length Flow Stress, Flow Curve, Fig. 1 A tensile test specimen
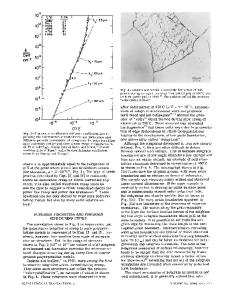
Flow Stress, Flow Curve, Fig. 2 Force–extension relation in simple tension for a mild steel
40 35
Tensile force/kN
30 25 20 15 10 5 0 0
5
10
15
20
Extension/mm
In metal forming the deformation, by definition, is plastic and so the yielding behavior of materials is the most important region to consider. The force and extension parameters need to be normalized to enable comparisons between different materials and specimen sizes. This can be done by converting the force to a stress defined as the force, F, divided by the area, A, over which it is applied. Thus, stress s = F/A. However, it is convenient to
Data Loading...