Freezing diagrams: Part II. Comparison with experimental observation and relevance to crystallization of metallic glass
- PDF / 1,011,616 Bytes
- 11 Pages / 590.28 x 785 pts Page_size
- 47 Downloads / 320 Views
IN Part
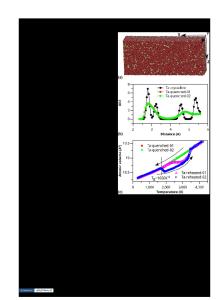
I, the freezing diagram where the solid-liquid interface temperature, Tx, is plotted against composition (Figure l(a)) was shown to be a useful guide in the prediction of microstructure after a cooling event has occurred. It was found that the important parameters in constructing a freezing diagram are To, TM, and Tg, where To is the temperature at which a single-phase crystalline solid of a given composition has a free energy equal to that of liquid of the same composition, TM is the temperature below which only massive crystallization (i.e., compositionally invariant transformation) can occur, and Tg is the glass transition temperature, lu The values of To, TM, and T~ can be used to plot a Time-Temperature-Transformation (TTT) diagram or a Continuous-Cooling-Transformation (CCT) diagram for a given alloy composition. In the following discussion, CCT diagrams will be constructed when discussing freezing processes, and TTT diagrams, rather than continuous heating diagrams, when discussing annealing processes. Figure 1(b) shows a CCT diagram for a representative composition, X, with To, T,,, and Tg marked. Since TM is a kinetic parameter, it accurately represents the temperature at which precipitation-type transformations cease. Below TM, only massive transformations are possible; otherwise, the liquid remains metastable until below Tg, where it becomes a glass. 1o, TM, and T8 give t h e locations of the limits of each transformation type, and, if the relationship between cooling rate and Tt is known, the relative positions of the CCT cu~'es with respect to the time axis can be estimated. If this relationship is not known, the type of transformation (i.e., precipitation or massive) will indicate the relative positions of the CCT curves in time (Figure l(b)). In Section I I - A , experimental observations of result-
DAVID H. St. JOHN, formerly with the Department of Mining and Metallurgical Engineering, University of Queensland, is with CRAAdvanced Technical Development, Perth, Western Australia. Manuscript submitted June 22, 1987. METALLURGICAL TRANSACTIONS A
ing microstructures are highlighted and discussed. Freezing diagrams also can aid in the prediction of crystallization and decomposition reactions obtained during annealing treatments, and this is discussed in Section II-B. In Section I I - C , the freezing diagram's ability to define the critical parameters which determine frozen and annealed microstructures is utilized to elucidate the processes and effects of liquid phase separation. An example of liquid phase separation cited in the literature is shown to be described more accurately as primary crystallization resulting in liquid phase stabilization. Finally, in Section III, predictive criteria put forward in the literature are discussed, and these can be enhanced or modified as a result of the viewpoint provided by freezing diagrams. II. T H E F R E E Z I N G D I A G R A M A N D EXPERIMENTAL OBSERVATIONS
A. Freezing Because most work on rapid solidification has been aimed at producing a particu
Data Loading...