Halo formation in eutectic alloy systems
- PDF / 3,134,450 Bytes
- 7 Pages / 612 x 792 pts (letter) Page_size
- 43 Downloads / 426 Views
,2t/l
- \ \ CI C3
CEC 4
C2
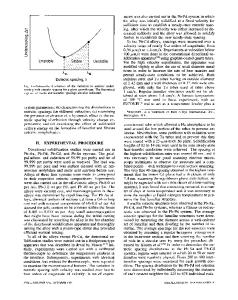
Fig. 1--Hypothetical phase diagram with c~ a good nucleant of /3, and /3 a poor nucleant of c~. is a poor n u c l e a n t for c~, and c~ grows a s a halo to move the liquid composition f r o m C3 to CE. While for c o m p o s i t i o n C1, c~ is a good n u c l e a n t for t3, and /3 grows as a halo to move the liquid back f r o m C4 to C E. Thus the l a r g e r halo is that of a good n u c l e a n t about a poor. E x p e r i m e n t a l j u s t i f i c a t i o n of this hypothesis was found in the Au2Bi-Bi e u t e c t i c . Kofler, 6 in h e r work on o r g a n i c e u t e c t i c s , has found that t h e r e is a c o m p o s i t i o n - t e m p e r a t u r e a r e a in which coupled growth can occur. By coupled growth, she m e a n s that both p h a s e s a r e growing with the s a m e velocity. The shape of this zone of coupled growth i s d e t e r m i n e d by the v a r i a t i o n of growth rate with und e r c o o l i n g and c o m p o s i t i o n of the p h a s e s involved. The growth rate of a phase was found to have two v a l u e s - - o n e if growing as a p r i m a r y , a second if growing in a s e c o n d a r y act of c r y s t a l l i z a t i o n , i.e., following behind a p r i m a r y phase. Fig. 2(b) exhibits growth r a t e - c o m p o s i t i o n c u r v e s for a l l o y s of a hypothetical s y s t e m at some c o n s t a n t t e m p e r a t u r e T1. Between c o m p o s i t i o n s C1 and C2, the growth rate of the two p h a s e s can be the s a m e and a coupled growth can occur. F i g u r e 2(c) shows a coupled zone on an equil i b r i u m phase d i a g r a m which is c o n s i s t e n t with Fig. 2(b). The n o n z e r o growth rate at t e m p e r a t u r e s and c o m p o s i t i o n s above the extended liquidus i m p l i e s that local c o n c e n t r a t i o n s in front of a phase in s e c o n d a r y growth can deviate s t r o n g l y f r o m the bulk c o n c e n t r a tion. The d i f f e r e n c e s in growth v e l o c i t i e s of the p h a s e s as s e c o n d a r y c r y s t a l s i n d i c a t e s that the liquid VOLUME 1, APRIL 1970 891
;.-7--'-'-'-
-'-'- ...."x
I C1
T
I C2
L
. . . . .
growt,h rate
1"a 13
To --/L
Lprimary A primar , y B ~
(b)
.a
T=T 1
s e c ~
A
Cl
2
. . . . . . . . . . . . . .
89
"1
___~_5~.
/ /
/ //
/
I
----
'," coupled ..~ I,/'/,/j ; i
zone J
: 1
\
I I
:
CI Ca l3
1
Cl3a
C2
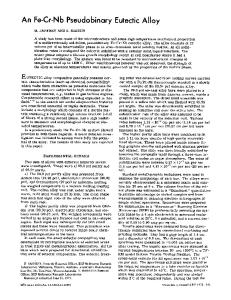
Fig. 3--Hypothetical phase diagram for a faceted-nonfaeeted eutectic system, fl, the faceted phase is the good nucleant. The coupled zone is skewed to the fl side of the phase diagram.
%) T1 ~
. . . .
_
. _ ~ _ ~ _ ~ _
- ~--f-~
.
.
.
coupled zone
_ _ .
.
.
I
,,
C1
. . . .
j
J
X----
C2
Fig. 2--(a) Phase diagram for simple eutectic system. (b) Hypothetical growth rate-composition curves at temperature T 1. (c) Coupled zone consistent with (a) and (b). c o m p o s i t i o n tends to move to one b o u n d a r y of the coupled zone where t h e r e is a definite leading phase. With K o f l e r ' s a n a l y s i s ,
Data Loading...