Heteroepitaxial Growth of Cubic GaN on GaAs(100) by Reactive Nitrogen Source
- PDF / 250,825 Bytes
- 5 Pages / 414.72 x 648 pts Page_size
- 47 Downloads / 322 Views
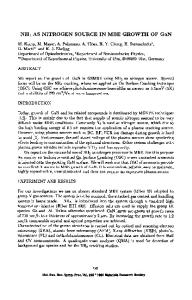
growth rate depended to a large extent on the temperature of the Ga source. It was estimated that the rate was 6-9 /min when the source was kept at 750TC. Fig. 1 shows the XRD spectrum measured from the as-grown sample. The inset is the GaN(200) peak located at 20=39.94'. The lattice constant derived thereby is 4.51 A, consistent with the values previously reported for cubic GaN [1]. It might be noticed that FWHM of the GaN peak here is 23 min only, indicative of the good crystalline quality of the GaN epilayer.
GaN (200)
39
20
40
60
40
80
41
100
120
20 (degrees) Fig. 1 XRD spectrum for the thick GaN covered sample. To be sure that the epilayer grown by the present method consists of pure GaN, XPS core level spectra of Ga3d, As3d and Nls have been measured and analyzed. As is expected, only the Ga and N' signals can be observed. In contrast to that, intensive As signals always appear in the spectrn taken from the samples prepared by simply exposing the GaAs substrate to the nitrogen ion beam, no matter how long the exposure time has been. This implies that the anion exchange 1between the nitrogen ion and GaAs has little effect on the formation of the thick GaN layer, though it is reported that a thin GaN layer can be produced on GaAs via such a reaction [11].
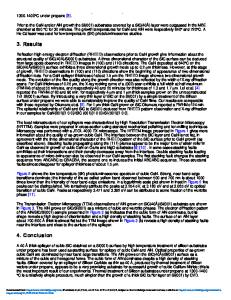
Xl 000 -,6
'
-1
0
1
2
00
3
4
'
5
6
7
8
9
10
11
12
Energy Loss ( eV ) Fig. 2 HREELS spectrum with primary beam energy of 30 eV
92
Further evidence for the formation of pure GaN is firom the interband transition data measured with HREELS. It has been shown in our previous work [12-14] that the band gap of a III-V compound semiconductor manifests itself as a sudden rise in the electron energy loss spectrum, provided that the energy of the primary electron beam is much larger than the band gap. Fig. 2 is such an energy loss spectrum measured from the epilayer, with the primary electron energy of 30 eV. The onset of the interband' transition appears at 3.2 eV. This value is comparable with the band gap values of GaN previously reported, ranging from 3.2 to 3.45 eV [1]. For characterizing a III-V semiconductor, HREELS can do even more. According to the dielectric theory, the long range interaction of the Coulomb field accompanying the incident lowenergy electron and the dipole field above the solid surface will result in a strong structure, called Fuchs-Kliewer (F-K) phonon, appearing at the frequency o•=OCTo[(o0+1)/(•8+1)]"/2 if the spectrum is measured in the specular direction. Here OTO is the frequency of the TO phonon, So the electrostatic dielectric constant, and P, the high frequency (optical) dielectric constant.
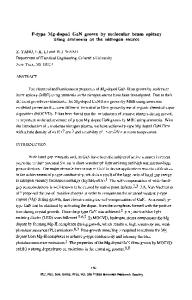
X(c)
(b)
(a)
-100
0
100
200
Energy Loss ( meV) Fig. 3 HREELS spectra with primary beam energy of 3 eV for (a) clean, (b) nitrogen ion exposed and (c) thick GaN covered samples. Shown in Fig. 3 are the HREELS spectra measured from (a) clean, (b) nitrogen ion beam exposed and (c) epilayer covered GaAs samples. The primary electron energy is 3 eV. The clean substrate shows a loss peak at 36 meV which is the F-K
Data Loading...