High-Gain, High-Speed ZnO MSM Ultraviolet Photodetectors
- PDF / 55,131 Bytes
- 6 Pages / 612 x 792 pts (letter) Page_size
- 35 Downloads / 323 Views
11.16
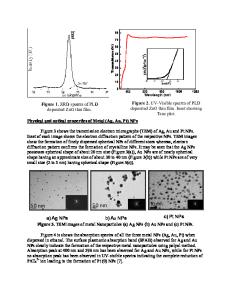
ultrasonic solvent cleaning process. E-beam metallization, photolithography, and wet chemical etching techniques were used to generate the electrode pattern. EXPERIMENTAL RESULTS Figure 1 shows the effect of electrical resistivity on growth temperature. The resistivity decreases as the growth temperature increases. A highly resistive film was obtained at 390°C. Undoped ZnO generally exhibits n-type behavior due to the presence of oxygen vacancies or zinc interstitials. Incorporation of nitrogen reduces the electron carrier concentration. Although a higher growth temperature is preferred to crack NH3, it actually results in lower resistivities. This is due to an increase in ZnO non-stoichiometry (Zn interstitials or O vacancies) at higher growth temperatures. DEZn Flow = 100sccm NH3 Flow = 5000sccm O2 Flow = 2000sccm
Resistivity (Ω−cm)
6
10
5
10
4
10
3
10
400
450
500
550
600
Growth Temperature (°C) Figure 1 Effect of MOCVD growth temperature on the electrical resistivity of N-doped ZnO films The solid line in Figure 2 shows the current-voltage (I-V) characteristics of the detector. Low dark current of 450 nA is achieved at 5V due to high resistivity. The dashed line in Figure 2 shows I-V characteristics under 6.4nW, 365nm UV photo-illumination. The linear I-V relations under both forward and reverse bias indicated the presence of an ohmic 5 Dark Current With photo-illumination: Pph= 6.4nW, λ = 365 nm
Current (µA)
4 3 2 1 0 0
1
2
3
4
5
Voltage (V) Figure 2 Dark (solid line) and photo-illuminated (dashed line) I-V
F99W11.16
Photoresponsivity (A/W)
metal-semiconductor contact and that the device is operating in photoconductive mode. The spectral photoresponse of the MSM photodetectors was measured using a Xe lamp and monochromator combination. A Newport 1830-C Optical Power Meter was employed to calibrate the light beam intensity. Figure 3 shows the spectral response of a ZnO photoconductive detector. A sharp cut-off near 373 nm is observed. The photoresponse drops by more than two orders of magnitude across the cut-off wavelength within 15 nm of the band edge. A photoresponsivity of about 400A/W is obtained under 5 V bias voltage at wavelengths from 373 nm to 300 nm. V = 5V 100
10
1
250
300
350
400
450
500
550
Wavelength (nm)
Figure 3 Spectral response of a ZnO MSM photodetector under 5 V bias. Figure 4 shows the photoresponse as a function of bias voltage from 1mV to 5V at 6.4nW, 365nm UV photo-illumination. A linear relation indicates that the device is operating in constant mobility regime. Assuming a carrier lifetime of 1 µs (discussed below), we find an electron mobility of ~ 100 cm2/V*s. 3
Photoresponsivity (A/W)
10
λ= 365nm O p tic a l P o w e r = 6 .4
2
10
1
10
0
10
-1
10
-3
10
-2
10
-1
10
0
10
V o lta g e (V ) Figure 4 Photoresponsivity vs. bias voltage of a ZnO MSM photodetector.
F99W11.16
1
10
We have also measured the photoresponse speed of the detector. The optical excitation source was a Ti:Sapphire regenerative amplifier-pumped optical
Data Loading...