In-Situ Processing and Reaction of C0 2 With Yb 2 cu 2 o 7-X
- PDF / 248,375 Bytes
- 4 Pages / 420.48 x 639 pts Page_size
- 36 Downloads / 425 Views
258
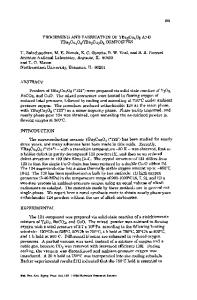
had increased to a constant level. Samples were subjected to as many as 10-15 cycles, although the levels of volatile species usually reached a constant value after the first 4-5 cycles. It should be noted that while the CO 2 TPD area dropped considerably, the entire source of CO2 was not removed. A sample for which the CO 2 level had been reduced to a constant value is hereafter referred to as a "clean" sample. Four point resistivity measurements were also performed during the cleaning cycles. These measurements showed the samples to be superconducting (Tc= 87±3 K), as measured at the midpoint of the transition. As the sample was cleaned, no change in Tc was observed. However, the width of the superconducting transition decreased as the H2 0, CO, and CO 2 concentrations were lowered. The width of the superconducting transition for the clean sample was 7 K, as opposed to 16 K for the same sample before the 02 annealing cycles. Fig. 1 shows a series of TPD curves for a sample of YBa 2 Cu 3O 7 .x exposed to a constant amount of CO2 at two different temperatures and two different oxygen stoichiometries. The spectra are vertically shifted from one another for viewing ease. In these experiments, the sample section of the chamber was filled with CO 2 to a total pressure of 1 Toff for 3600 sec. After exposure, the chamber was evacuated to a pressure of less than 1 x 10⁻⁷ Torr before beginning a TPD experiment. The TPD curve shown in Figure la is the CO 2 inherent in the clean
1.0
•
0.8
"- 0.6
0.4
-•
(e)
(d)
Or
p
~0.2
(a)
0.01
300
J..,,
400
I
-
"
500 600 700 800 Temperature (K)
900
Figure 1: CO2 TPD signal from (a) the clean YBa 2 Cu 3 06.9 sample and (b) the 02 desorption signal from the same clean YBa 2 Cu 3 06. 9 sample (dashed curve). Curves c-e are the CO 2 TPD signals from samples that were exposed to 1 Torr CO 2 for 3600 sec. CO 2 TPD results from (c) YBa 2 Cu 3 06.9 exposed at 350 K, (d) YBa 2 Cu 3 06.5 exposed at 350 K, and (e) YBa 2 Cu 3 06.5 exposed at 635 K.
259
sample before exposure to any CO 2 . Desorption of CO2 from the clean surface is a broad peak centered at about 550 K. The dashed curve (Figure lb) is the 02 desorption signal from the clean surface monitored at the same time as Fig. la. Fig. lc shows the CO 2 desorption results for a CO 2 exposure to YBa 2 Cu 3 06. 9 at 350 K. The width of the CO 2 desorption is broad, however the desorption ends at the same temperature as the clean surface. CO 2 was also exposed to YBa 2 Cu3 06. 5 , which was generated by heating YBa 2 Cu3 06.9 to 925 K in vacuum [7]. CO 2 desorption from YBa 2 Cu 3 O6. 5 exposed at 350 K is shown in Fig. ld. A small desorption peak is observed near 350 K. The low temperature peak is most likely due to physisorbed CO 2 as the intensity in the peak can be varied by changing the evacuation time between the end of the exposure and the start of the TPD experiment. Due to the width of the high temperature desorption state, one can not rule out the possibility of multiple desorption states under the curve. Fig
Data Loading...