Is there a waste Kuznets curve for OECD? Some evidence from panel analysis
- PDF / 1,451,205 Bytes
- 15 Pages / 595.276 x 790.866 pts Page_size
- 6 Downloads / 366 Views
RESEARCH ARTICLE
Is there a waste Kuznets curve for OECD? Some evidence from panel analysis Fırat Yılmaz 1 Received: 11 March 2020 / Accepted: 28 April 2020 # Springer-Verlag GmbH Germany, part of Springer Nature 2020
Abstract We empirically investigated the existence of a Kuznets curve for OECD area in terms of municipal solid waste generation by utilizing a panel data covering the 2002–2017 period. Results from GMM and between estimators conclude that an inverted Ushaped Kuznets relationship holds for OECD countries, but only in relative terms. Results show that consumption expenditure is one of the main drivers of waste generation. Country-based estimations of random coefficient approach state that 8 out of 16 highincome countries and only 2 out of low-income countries have achieved decoupling the waste generation from consumption expenditures. Some policy implications are recommended. Keywords Kuznets curve . Waste . Decoupling
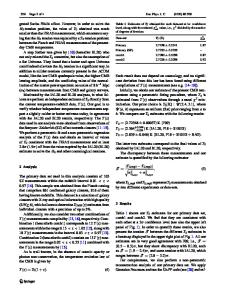
Introduction Solid waste generation is inevitable as long as the human race exists (Shekdar 2009). Rapid urbanization, increasing population, rising prosperity, and consumption levels have positively contributed to the amount of solid waste generation and led to a global challenge of sustainable management of waste problem (Beede and Bloom 1995; Wang and Nie 2001; Saeed et al. 2009; Getahun et al. 2012; Kaartinen et al. 2013; Khan et al. 2016) and put the pressure on earth so that the waste generated has already gone beyond 30% of Earth’s carrying capacity (Irwan et al. 2013). The amount of waste generated has reached alarming levels. Each year, 2.01 billion tonnes of municipal solid waste (MSW) is generated globally. Optimistically, 33% of this waste is not treated with an environmentally safe way. The average daily per capita MSW generated is around 0.74 kg with a variation between 0.11 and 4.54 kg. The amount of MSW generated is predicted to increase 3.40 billion tonnes till 2050. Although they form only 16% of the world’s
Responsible editor: Nicholas Apergis * Fırat Yılmaz [email protected] 1
Department of Economics, Antalya Bilim University, Antalya, Turkey
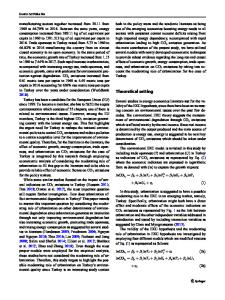
population, high-income countries are responsible for 34% or equally 683 million tonnes of the total waste generated (Kaza et al. 2018). Figures 1 and 2 show global MSW generation by country and income groups respectively. The MSW generated has increased mostly coherent with private consumption expenditures and GDP in OECD area during the 1990s. This increase seems to have slowed down after 2000; nevertheless, the total amount of MSW generated has already surpassed 650 million tonnes (equally 522 kg per capita) annually. The amount and components of the MSW varies due to income difference, consumption patterns, urbanization rates, lifestyles, and waste management practices. The recycling rates have shown significant increase; however, landfilling is still the main way how the MSW is treated in some OECD countries (OECD 2016). Figure 3 shows the amount of MSW generated among OECD countries. In this paper, we focus o
Data Loading...