Laser Direct Writing of Aluminum Conductor Lines from a Liquid Phase Precursor
- PDF / 334,136 Bytes
- 6 Pages / 414.72 x 648 pts Page_size
- 8 Downloads / 300 Views
Mat. Res. Soc. Symp. Proc. Vol. 397 ©1996 Materials Research Society
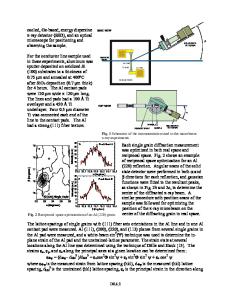
performed under a nitrogen environment. The cell is mounted on a PC-controlled three dimensional translation stage. The substrate is submerged in a thin layer of liquid TIBA, whose thickness is controlled to avoid defocusing of the laser beam. The experiments were conducted with a laser input power of 0.2 W to 1.0 W (0.6 to 3.6x10⁶ W/cm2), and a linear scanning speed of 10 jim/sec to 10 mm/sec. TEMPERATURE CALCULATION To characterize the LLCVD, we need to know the substrate surface Steady State Surface Temperature vs Radius P=O.6W temperature rise in the laser interaction zone. Since there is no conventional method available to measure the temperature distribution for such small * Q(r,z) withR=R(TO),alpha=alpha(TO) areas experimentally, the temperature rise + O(r,z) withR=R(Tmax),alpha=alpha(Tmax) at the reaction site is calculated by finite o O(r,z)with R=R(TO),alpha=alpha(Tmax) difference method. The small irradiated . : Q(rz) withR=R(T),alpha=alpha(T) x: Q(r,z)withR=R(T),alpha=alpha(Tmax) area reaches a steady state in tens of jis, E so time independent calculations can be The Lax model 4 for laser utilized. induced temperature calculation is an analytical solution, assuming that the substrate optical absorption coefficient is 2 3 0 1 temperature independent. Neglecting the Radius R/w (w=-.5um ) temperature dependent of the substrate Figure 1. Temperature calculation using different optical absorption coefficient and combination of parameters will dramatically reflectivity underestimate the peak laser induced temperature when room temperature of these parameters are used. Figure 1 gives the results of a finite difference numerical simulation of the laser induced temperature distribution on a silicon substrate and the Lax calculation for different assumptions of constant reflectivity and absorptivity. The numerical simulation uses temperature dependent thermal conductivity, optical absorption coefficient, alpha, and optical reflectivity, R, while only the thermal conductivity is temperature dependent in the Lax calculation. To is the ambient temperature and Tm 5x is the maximum temperature rise for each curve. From the figure, we can see that if we use the Lax model and iterate R and alpha to their values at the maximum temperature, we achieve a close approximation to the finite difference method using temperature dependent parameters for significantly less computing time. RESULTS AND OBSERVATION Laser CVD deposits grow both vertically and laterally, so we evaluated the deposition rate and activation energy for volume growth. The volume deposition rate in scanning deposition mode is defined as: r,= SxV where S is the line cross-section area, V is the scanning speed and r, is the volume deposition rate. The volume deposition rate for two different laser powers is plotted in Figure 2.
638
Volume Growth vs Dwell Time P=0.63W =L U 61
8
,,t -4
E
P=0.37W
.
4-
~
2
6-
0
2
4
6
8
10
12
14
6 16
P=O.63W P=0.37W
4-
7
3-
1
E
- -
Data Loading...