Luminescent Amorphous Silicon Layers
- PDF / 317,031 Bytes
- 5 Pages / 414.72 x 648 pts Page_size
- 36 Downloads / 389 Views
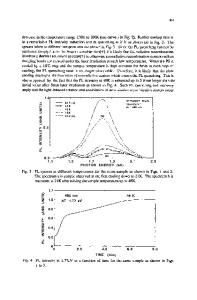
variation with interatomic distance d. The dangling bonds arising at the surface of the slab 47, a-Si:H are saturated by hydrogen atoms and Harrison 20 A a-Si parameters [16] are used for the first-nearest 2.0 A . c-Si LDA neighbor Si-H interactions. We have checked a c-Si sp3s* for a c-Si (100) slab (Fig. 1) that the energy •1.5[]3 difference between our sp3s* tight-binding calculation and the results obtained by a firstprinciples calculation [15] is quite small for a A slab thickness larger than 1.5 nm and slightly 1.0 increases below that size reaching 0.1 eV for a A thickness smaller than 1 nm. This gives good confidence to use a sp3s* tight-binding to cal0.544 culate the a-Si:H slab energy levels close to the 1 243-4 band gap. The starting structure for a-Si:H D (nm) slabs is obtained by selecting the atoms Fig. 1 Gap variation as a function of the size belonging to a slab of a given thickness in the calculated for a c-Si slab by a sp3s* tight4096 atoms unit cell of our hydrogenated binding method (full dots) and by first-prinWWW model. Due to these new boundary ciple [15] (square dots) compared to the conditions the structure is no more in equilibmean gap of a-Si (triangles) or a-Si:H slabs rium and we have thus relaxed the atomic posi(empty squares) and to the experimental tions using a Keating potential [17] as in the luminescence peak energy [4] (crosses). original WWW model. Figure 1 shows the average HOMOLUMO gap versus size for slabs with randomly chosen center in the 4096 unit cell. For thick slabs, the gap energy is larger for a-Si:H than for c-Si. This is due to the larger gap for the bulk amorphous phase. As one decreases the size of the slab, the difference decreases. This is due to the fact that the HOMO and LUMO states in a-Si:H are moderately localized [9] and are less sensitive to the confinement that the delocalized gap edges states in the c-Si structure. Below 1 nm, the gap energy curves are rather parallel due to the fact that the sizes of the HOMO and LUMO states are in both phases larger than the slab one. Nevertheless, this leads for thin amorphous slabs to HOMO-LUMO gaps smaller than in the crystalline one. Such a blue shift can also be seen in the experimental values [4] for Si/Si02 superlattices. However one must notice that the experimental result does not depend on the growth method or on the presence of hydrogen in the layers. For a-Si layers, a large dependence of the calculated HOMO-LUMO gap is also obtained with respect to the layer thickness below 3 nm but on the contrary of the experimental result, the gaps are much smaller than for a-Si:H layers due to a large number of localized states [9,12]. For thick slabs, the calculated values for a-Si:H layers are -0.3 eV smaller than the experimental results. For these sizes, the confinement energy is small and the error due to the tight-binding sp3s* method is expected to be small. However, it is important to notice that our values correspond to the HOMO-LUMO gap whereas the experimental values measure the maximum of the luminescence
Data Loading...