Mapping of Strain Tensor Components in Polycrystalline Samples using EBSD.
- PDF / 18,038,383 Bytes
- 6 Pages / 612 x 792 pts (letter) Page_size
- 69 Downloads / 304 Views
Mapping of Strain Tensor Components in Polycrystalline Samples using EBSD. David J Dingley1, Graham Meaden2, Seiichi Suzuki3 and Tatsuya Fukino3 1
H.H.Wills Physics Laboratory, University of Bristol, Tyndall Ave. Bristol BS18 1TL, UK. BLG Productions Ltd. 3 Sydenham Rd. Cotham, Bristol BS6 5SH, UK. 3 TSL Solution 252-0131 Sagamihara Midori-ku, Nishihashimoto 5-4-30 SIC2-401 Japan 2
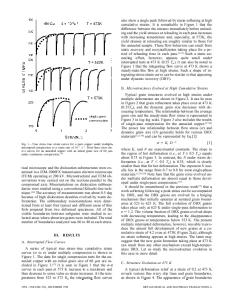
ABSTRACT The advance in Electron Backscatter Diffraction known as High Resolution EBSD has permitted the strain tensor components and neighbour disorientation measurements to be mapped at resolutions better than 2 parts in 10000. Following earlier research into this technique which was focused on verifying the sensitivity and accuracy of the measurements, recent studies have involved investigations on semiconductor and metallic polycrystalline materials. In particular observations of localized regions where residual strains exceeded the macroscopic yield stress have been thoroughly investigated to eliminate experimental error as a possible explanation. No such cause was found. Strain measurements on polycrystalline steels in uniaxial tension and during thermal stress relieving thermal treatment have also been carried out. Maps of the strain distribution during elastic loading and early stages of plastic flow showed hot spots of high strain as in the static tests but overall the measured elastic strain was equal to the applied strain. INTRODUCTION Electron Backscatter Diffraction, EBSD, as adapted for use in a scanning electron microscope is now a widely accepted technique for the mapping of crystallographically related features of a material’s microstructure, [1]. Features include crystallographic phase, crystal orientation, neighbouring grain misorientation, grain size as a function of phase and crystal orientation, Schmid and Taylor factor mapping and various ways of mapping the residual distortion of plastically deformed materials. In figure 1 are shown several maps that illustrate this. Figure 1a is an inverse pole figure map, where the grains are coloured (shaded) according to the crustal direction normal to the sample surface. Figure 1b is another IP map but from heavily cold rolled steel. Figure1c is a map in which β needles are retained in α matrix. Figure 1d is a phase map showing a band of magnetite and hematite crystals in quartz matrix. In figure 1e the crystals are coloured according to their respective crystal normal. The corresponding pole figures are shown in figure 1f and finally in figure 1g are drawn the histograms of the grain size distribution for each phase. The technique is now replacing the more traditional x-ray methods for crystal texture and for crystal phase determination, [2,3].
Figure 1. Examples of microstructural mapping using EBSD. A) orientation map, b) map of cold rolled steel, c) phase map alpha/ beta titanium (alpha red), d) rock sample, quartz (red, cubic, 75%), magnetite, (yellow cubic 20%), hematite,( green trigonal 5%), e) orientation map for each phase, f) pole figures for quartz, magnetite, h
Data Loading...