MOCVD HTSC Precursor Delivery Monitored by UV Spectroscopy
- PDF / 274,856 Bytes
- 6 Pages / 414.72 x 648 pts Page_size
- 115 Downloads / 307 Views
transition-0.
EXPERIMENTAL To examine the variability of thd complex delivery as a function of time and temperature, we have initiated a spectrophotometric study of metal-thd complex concentration in bubbler effluent. Experimental measurements were made using a system consisting of a mass flow controller, temperature controlled bubbler, thermostated delivery lines, optical cell, spectrophotometer, cold trap, capacitance manometer and vacuum pump. During transport studies, the carrier lines and optical cell were thermostated at 10°C above the temperature of the bubbler. All measurements were made at 760 Torr using 99.999% Ar as a carrier gas at a flow 149 Mat. Res. Soc. Symp. Proc. Vol. 415 01996 Materials Research Society
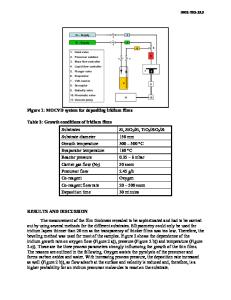
rate of 50.0 sccm. Heated carrier gas is passed through a dip-tube bubbler to a 10 cm path length high-temperature optical cell and finally through a cold trap. UV spectra were recorded using a Varian Cary 5E spectrophotometer. Gas phase spectra were recorded between 200 and 400 nm. In isothermal experiments, spectra were recorded over a four hour period. Temperature dependent studies were initiated after a system purge of two hours. System stability was examined using a bubbler loaded with anthracene. Absorbance measurements were found to have relative standard deviation of less than 1 percent. An Emcore MOCVD reactor was modified to include Guided Wave flow cells. The 10 cm cells were inserted between the reactor bubblers and the deposition chamber. UV light was generated using an Oriel D2 lamp housing and power supply which was compensated by an Oriel photo-feedback controller. The desired wavelength was selected using narrow bandpass filters. Light was carried to and from the flow cells using fused silica single fibers. Transmission was measured using an EG&G silicon photodiode. Figure 1 100%
3
0
0
0
0
a A a
cc
75%
0
50%
0 A
A
0 a
0 A
A
A
A
A
B
25%
0
0
0
0
~ 00 S0
0% 0
50
100
150
200
250
Bubbler Purge Time (min) RESULTS Figure 1 shows how the relative gas phase concentration of Ba, Cu and Y thd complexes change as a function of bubbler purge time. The absorbance at 297 nm in the gas phase UV spectra of Cu(thd) 2 changes by 10 percent over a four hour period. Similarly, the absorbance at 286 nm for Y(thd) 3 at 286 nm was found to decrease by 14 percent over four hours. Studies conducted with Y(thd) 3 using the fiber optic system installed in an Emcore reactor exhibited similar results. As with Cu(thd) 2 and Y(thd) 3, the concentration of Ba4(thd)B in bubbler effluent also changes as a function of time. The absorbance at 269 nm was found to decrease by over 80 percent during a four hour period. The variability of precursor concentration in bubbler effluent is consistent with variations in transport rates observed for Cu(thd) 2 and Y(thd) 311. Evaporation rates
150
of Cu(thd) 2 and Y(thd) 3 have also been examined and were found to decrease as a function of time 12. This decrease was attributed to a change in the effective surface area of the solid precursor1
Data Loading...