Molecular Dynamics Simulations of Porous Silica
- PDF / 1,063,756 Bytes
- 6 Pages / 414.72 x 648 pts Page_size
- 31 Downloads / 448 Views
Porous solid 0.3-0.7 g/ml
Glass 2.2 gIml Ireduce chargesJ
.gmlass ] Glass
li~rýýharge)
expand box }
liquid Homogeneous
es/ -ch . g/mlarg r2.2ed ted.
l
iudu g/ml
C8Y5CS0.3-0.7
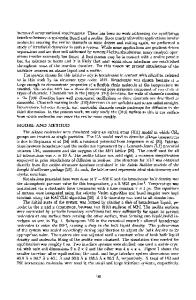
reduced charges Figure 2: Structure of porous silica at density 0.36 g/ml
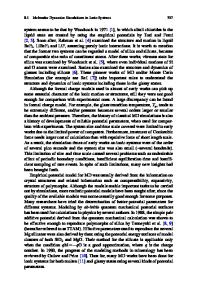
Figure 1: Simulated preparation of porous silica. charges qsi = 1.6 and qo = -0.8
on silicon and oxygen atoms respectively. The two body
terms axe truncated at 5.0 A, for the three body terms a cutoff of 2.6 A is used. The long range part of the Coulomb interaction is computed using a PPPM method [5]. All simulations were done in the NVT ensemble. We produced porous structures at densities 0.71, 0.56 and 0.36 g/ml (compare with the normal density of glass of 2.2 g/ml). The low density liquid phase is thermalized for a few ps, so that the reduced charge atoms can diffuse and form a homogeneous phase. The charges are scaled from 20 to 100% in 16 ps. The charge scaling factor increases proportionally with the square root of time, so that Coulomb energy increases roughly linearly in time. The temperature during this part of the run is 600 K to facilitate atomic rearrangements. Subse-
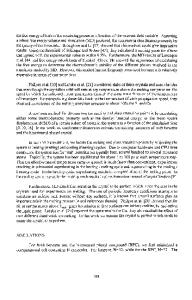
quently the structures are thermalized at 300 K for 20 ps, where solidification is reached after around 10 ps. The process of solidification is monitored by the mean square displacement (MSD) from starting positions (see fig. 3). The change of slope in the MSD plot indicates different regimes in the structural changes as charges are increased. The evolution of the radial distribution functions (fig. 4) shows that between 0 and 8 ps the first neighbor peak is formed. The second and further neighbor peaks evolve between 8 and 16 ps. After 16 ps (which is the thermalization part of the run) no changes occur at short range, but the long distance tail is still growing. RESULTS Upon gradual increase of the atom charges a percolating porous solid is formed, where both the silica and the void phase are fully connected, (fig. 2). There axe no unbound atoms or groups of atoms and less than 1% of the voids is isolated from the major pore. The porosity of a structure is defined as the empty volume per gram of material. The empty volume was measured by dividing the volume into small cubes of 5 A wide and counting the number of empty cubes. Results are presented in table 1. The radial distribution function g(r)of the porous silica obeys a power law behavior on length scales of r = 5 - 20 A. The mass fractal dimension of the structure can be derived
152
3 10'
2 --.... _E
IOp
6
SI0. E
_
E
0
-0, 1
0
'
0
,-
10
,
*
20
,
30
~10
-
,
40
I
50
1
time (ps)
r (nm)
Figure 3: Mean square displacement during the charge scaling and thermalization.
Figure 4: Si-O radial distribution functions during the formation runs.
Table 1: Properties of simulated porous silicas. Density (g/ml) 0.71 0.56 0.36
Porosity (ml/g) 0.73 1.12 2.04
Fractal dimension 2.60 2.59 2.48
Surface (m2/g) 780 900 1420
Dielectric constant 1.19 1.15 1.10
Susceptibility 0.015 0.012 0.008
from this power law
Data Loading...