Morphotropic Phase Boundary in the Nanocrystalline PbZr x T 1-x O 3 System
- PDF / 367,525 Bytes
- 6 Pages / 414.72 x 648 pts Page_size
- 22 Downloads / 384 Views
Mat. Res. Soc. Symp. Proc. Vol. 452 01997 Materials Research Society
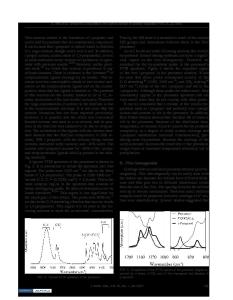
investigations on MPB. For example, the ionic polarizabilities in PZT compositions were calculated by the Clausius-Mossotti-Lorentz-Lorentz equation and the resultant gap of the polarizability appearing at the MPB composition suggested that the phase transition boundary is to be due to the electrostatic long-range dipole moment [17]; A statistical model was proposed to address the problem of two-phase coexistence near the MPH [18]. In this paper, our investigations will be focused on these interesting problems using Micro Raman scattering on nanocrystalline PZT materials. EXPERIMENTAL Nanocrystalline PbZr.Ti1 ,O 3 ( with x = 0.0, 0.1, 0.2, 0.3 ........ 1.0) materials were separately prepared, essentially using a sol-gel in which lead acetate, titanium butoxide and zirconate butoxide were used as the precursor PbTil-xZrxO 3 materials. The processes involved dissolving the metal-containing compounds in the solvent, hydrolyzing and drying the X=1.0 resulting solution into various gels, and finally heat treating these gels at different x=0.8 temperatures and for different time intervals to form nanocrystalline PZT 0.7 powder. Chemical phase analysis was done ... from power XRD measurements, using a computer controlled x-ray diffractometer S, xl0.6 model Siemen D-5000 with a typical -2I scan speed of 0.3' min1. The average grain size (dxRD) was x=0.5 calculated from the full width at half Fn z maximum(FWHM) of the (111) diffraction w x0.4 A peak using the Scherrer equation dxR K2,fl(0)CosO. Where X is the x-ray wavelength, 0(0) is the FWHM of the diffraction line, 0 is the angle of diffraction, and the constant K ; 1. This equation assumes the small crystallite size to be the only cause of line broadening. The Raman spectra were excited using the 514.5 nm radiation line from a Coherent Innova 99 Ar-ion laser. The 90 70 10 30 50 power impinging the sample was kept at 10 WAVE NUMBER(cm' 1 ) mW. Jobin-Yvon T64000 Spectrophotometer with subtractive pre-monochro Fig.la Low frequency Raman spectra for PZT with grain size of 60 nm mators coupled to the third spectrograph monochromator with 1800 grooves/mm grating was used for recording the spectra. The liquid nitrogen cooled charge coupled device (CCD at 140 K) detector was employed to record the Raman signals. All of the spectra were taken in the back-scattering geometry with a 20 x microscope objective that allows 10 mm of
858
working distance and t 5x10 3 ýtm 2 of illuminated area. A resolution of 1.9 cm-' was used as measured from the width of Ar-ion plasma lines.
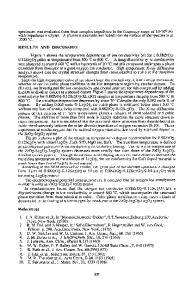
RESULTS AND DISCUSSION Low and high frequency Raman spectra for PZT with grain size of 60 PbTil-xZrxO3 nm are respectively shown in Fig. la PbTil-Zrx0 3 and lb. Fig. 2 displays the dependence of Raman phonon modes with varying Zr concentration. The lowest Raman spectrum, exhibiting all features of the =1.0 tetragonal phase as observed in bulk PbTiO 3(PT) [19], corresponds to that of =0.8 nanocrystalline PT. In fact, the critical grain size
Data Loading...