Multimodal luminescence spectra of ion-implanted silica
- PDF / 216,441 Bytes
- 5 Pages / 612 x 792 pts (letter) Page_size
- 50 Downloads / 343 Views
ultimodal Luminescence Spectra of Ion-Implanted Silica1 H.-J. Fittinga^, Roushdey Salha, and B. Schmidtb a
b
Institute of Physics, University of Rostock, D-18051 Rostock, Germany Research Center Rossendorf, Institute of Ion Beam Physics and Materials Research, P.O. Box 510119, D-01314 Dresden, Germany ^e-mail: [email protected] Submitted September 12, 2006; accepted for publication October 3, 2006
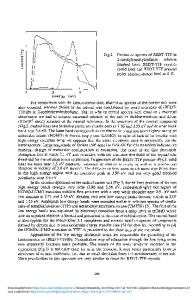
Abstract—The main luminescence bands in silica SiO2 are the red luminescence R (650 nm, 1.9 eV) of the non-bridging oxygen hole center, and the blue band B (460 nm, 2.7 eV) and ultraviolet luminescence UV (290 nm, 4.3 eV), both commonly related to oxygen-deficient centers. In the present work, we will enhance or replace either the first or second constituent of SiO2, i.e., silicon or oxygen, isoelectronically by additional implantation of the respective ions. Thus, thermally oxidized SiO2 layers have been implanted by different ions of the IV group (C, Si, Ge, Sn, Pb) and of the VI group (O, S, Se) with doses up to 5 × 1016 cm–2, leading to an atomic dopant fraction of about 4 at % at the half depth of the SiO2 layers. Very surprisingly, the cathodoluminescence spectra of oxygen- and sulfur-implanted SiO2 layers show, besides the characteristic bands, a sharp and intensive multimodal structure beginning at the green region at 500 nm up to the near infrared. The energy step differences of the sublevels equal on average 120 meV, and indicate vibration associated electronic states, proba–
bly of O 2 interstitial molecules. PACS numbers: 78.60.Hk, 61.72.Ww DOI: 10.1134/S1063782607040185 1
1. INTRODUCTION
Silicon dioxide is an important material for microelectronic devices, optical fiber communications, and even photonics [1]. The performance of electronic and optical devices depends, in part, on the presence of extrinsic as well as intrinsic defects in the SiO2 network [2]. Cathodoluminescence (CL) microscopy and spectroscopy in a scanning electron microscope (SEM) is a technique with sensitivity to and high spatial resolution of luminescent defect centers in insulator materials [3, 4], especially in thin layers. The main luminescent bands at room temperature (RT) are the red luminescence R (650 nm, 1.9 eV) of non-bridging oxygen hole center (NBOHC), and the blue band B (460 nm, 2.7 eV) and ultraviolet luminescence UV (290 nm, 4.3 eV) both attributed to the oxygen-deficient center (ODC) [5, 6]. At low temperatures, a green–yellow luminescence band G (540 nm, 2.3 eV) is observed in the first few seconds of irradiation and has been attributed to the self-trapped exciton (STE) [7]. Moreover, a yellow band Y (560 nm, 2.2 eV) appears after lengthy irradiation, i.e., after doses of 2 A s/cm2 [8]. In order to investigate whether the different luminescent centers are related to oxygen or to silicon, we have compared non-stoichiometric SiO2 layers pro1 The
text was submitted by the authors in English.
duced by direct ion implantation. Oxygen implantation, and, conversely, direct silicon implantation, led to an
Data Loading...