Near-field photoluminescence spectroscopy of localized states in InGaAsN alloys
- PDF / 138,001 Bytes
- 6 Pages / 612 x 792 pts (letter) Page_size
- 76 Downloads / 509 Views
Near-field photoluminescence spectroscopy of localized states in InGaAsN alloys. A. M. Mintairov1,2, P. A. Blagnov2, T. Kosel1, J. L. Merz1, V. M. Ustinov2, A. S. Vlasov1, R. E. Cook 3. 1
Electrical Engineering Department, University of Notre Dame, Notre Dame, IN, 46556 Ioffe Physical-Technical Institute RAS, Polytechnicheskaya 26, St.Petersburg, Russia 3 Argonne National Laboratory, Argonne, IL, 60439. 2
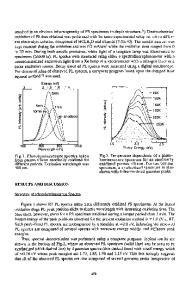
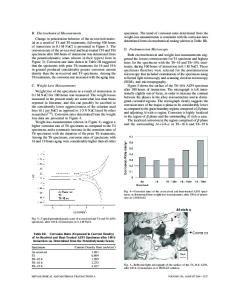
ABSTRACT We used near-field magneto-photoluminescence scanning microscopy to study structural and optical properties of quantum-dot-like compositional fluctuations in GaAsN and InGaAsN alloys. We show that these fluctuations manifest themselves by the appearance of narrow emission lines (halfwidth 0.5-2 meV) at temperatures below 70K. We estimated the size, density, and nitrogen excess of individual compositional fluctuations (clusters), revealing phaseseparation effects in the distribution of nitrogen in GaAsN and InGaAsN. We found a dramatic difference in the Zeeman splitting of cluster lines between GaAsN and InGaAsN, indicating a strong effect of In on the exciton g-factor. INTRODUCTION InxGa1-xAs1-yNy (x~0-0.08, y~0-0.05) alloys have recently attracted considerable attention as promising materials for laser diodes in the 1.3 -1.5 µm range as well as more efficient solar cells. These applications exploit their unusual electronic property - a ''giant bowing'' parameter (b~20eV), which arises from the large electronegativity and small size of the nitrogen [1, 2]. In our recent study [3] we used temperature-dependent near-field magneto-photoluminescence spectra to observe the localization of excitons on quantum-dot-like (QD-like) compositional fluctuations of In0.08Ga0.92As0.97N0.03. Localization is driven by the giant bowing parameter of these alloys and manifests itself by the appearance of ultranarrow lines (halfwidth 100K the shift of the A1 band energy follows the behavior typical for band gap emission of a bulk semiconductor: a decrease of the emission energy with increasing temperature due to thermal expansion, which is well described by the Varshni model [3, 5]. For lower temperatures, however, the A1 band shows an inverted behavior, which indicates onset of the carrier localization. We attribute the Abands to the emission of excitons localized on composition fluctuations having spatial extent 2r, much greater than the exciton radius (rexc) which is ~10 nm (weak localization regime), and we attribute the C-lines to emission of excitons localized on QD-like clusters having r≤rexc (strong localization regime). The difference between Varshni’s model predictions and the observed energy positions of the emission lines for T>y) of the clusters. In contrast to the Zeeman splitting results, we observed a clear diamagnetic shift for the C-lines in both GaAsN and InGaAsN alloys. We measured the value of the diamagnetic coefficient to be β= 3-12 µeV/T2. The cluster radius for different emission energies deduced from β [3] is presented in Fig. 3. It has a value 12±5 nm for InGaAsN and 9±2 nm for GaAsN. It should be
Data Loading...