Noninvasive evaluation of diabetic patients with high fasting blood glucose using DWI and BOLD MRI
- PDF / 1,906,546 Bytes
- 11 Pages / 595.276 x 790.866 pts Page_size
- 80 Downloads / 263 Views
KIDNEYS, URETERS, BLADDER, RETROPERITONEUM
Noninvasive evaluation of diabetic patients with high fasting blood glucose using DWI and BOLD MRI Shuang‑Shuang Zheng1,2 · Yue‑Ming He2 · Jie Lu1,3,4 Received: 19 June 2020 / Revised: 10 September 2020 / Accepted: 21 September 2020 © Springer Science+Business Media, LLC, part of Springer Nature 2020
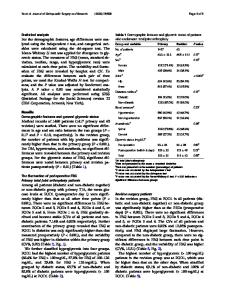
Abstract Purpose To investigate the renal microstructure changes and hypoxia changes in type 2 diabetic patients and the relationship between them and glucose using both diffusion-weighted imaging (DWI) and blood oxygenation level-dependent magnetic resonance imaging (BOLD MRI). Methods After measuring morning fasting blood glucose, DWI and BOLD MRI were performed in 57 patients with type 2 diabetes mellitus (DM group) and 14 healthy volunteers (NC group). According to the fasting blood glucose levels, diabetic patients were divided into a normoglycemic diabetes group (group A), a less hyperglycemic diabetes group (group B) and a more hyperglycemic diabetes group (group C). The renal parenchymal apparent diffusion coefficient (ADC), renal cortical R2* (CR2*), and medullary R2* (MR2*) were measured, and the R2* ratio between the medulla and cortex (MCR) was calculated. To test for differences in ADC, R2*, and MCR among the four groups, the data were analyzed by separate one-way ANOVAs. The correlations between ADC, R2*, and MCR and the clinical index of renal function were analyzed. Results Groups B and C had significantly lower ADC values in the renal parenchyma (P = 0.048, 0.002) and significantly higher MR2* and MCR values (P 9.0 mmol/l (n = 15). All volunteers in the normal group had blood glucose levels of less than 6.1 mmol/l.
Imaging technique All MR images were obtained on a 1.5-T whole body MR scanner (Signa 1.5 T, General Electric, United States) with a 4-channel body coil and a postprocessing workstation (AW 4.2). The scanning parameters were as follows: For axial DWI scanning, we used a spin echo-echo planar imaging (SE-EPI) sequence, fat suppression: water excitation, repetition time (TR) = 3725 ms, echo time (TE): minmum, fieldof-view (FOV) = 38 cm, number of excitations (NEX) = 8, B value = 0,800 s/mm2, 3 scanning directions, layer thickness = 6 mm, interval = 1.0 mm, matrix size = 128 × 128, and layer number = 19, was acquired during a 14 or 15second breath hold acquisition time: 1 min and 59 s. For coronal T2-weighted imaging (T2WI) scanning, we used an SE sequence, TR = 7500 ms, TE = 85 ms, FOV = 36 cm, NEX = 4, layer thickness = 5 mm, layer interval = 1.0 mm, matrix size = 320 × 192, and layer number = 14–18. For coronal T1-weighted imaging (T1WI) scanning, we used a a fast spoiled gradient echo (FSPGR) sequence, TR = 150 ms, TE = 4.2 ms, layer thickness = 5 mm, interval = 1.0 mm, matrix size = 320 × 192, and layer number = 14–18. For T2* MAP scanning (kidney BOLD), we used a 16 echoes fast gradient recalled echo-echo planar imaging (GREEPI) sequence, fat suppression: CHEmical Shift Selective, EPI train = 192, TR = 100 ms, TE: 3.2–81.8 ms (equidistant
Data Loading...