Optical Properties and Corrosion Resistance of Durable Silver Coatings
- PDF / 964,621 Bytes
- 6 Pages / 391.5 x 607.5 pts Page_size
- 54 Downloads / 365 Views
salt fog testing.[4] EIS has also be used to study metal coatings experiencing a loss of adhesion.[5] While this technique has been well developed, to our knowledge, this is the first time it has been used to evaluate optical materials. It may show promise as a rapid, quantitative alternative to the salt fog and humidity testing used to qualify field optics. EXPERIMENT All films were deposited in a cryopumped chamber equipped with 4 rf sputter guns employing 2 inch targets. The substrates were loaded on to a carousel that rotated at 40 rpm. 22 sccm of Ar and 4.4 scem of N2 flowed into the chamber and the pump was throttled to achieve a pressure of 0.53Pa (4.0 mT). Specific deposition parameters are given in the table below. The substrates used were test quality silicon wafers and fused silica. Thickness values for silver and silicon nitride were obtained from QCM deposition rate monitors that were
calibrated to much longer depositions via optical and profilometer techniques. The thickness values for NiCrNx were based on deposition time calibrated to thicker films. Table I. Depositiorn conditions Comrpound Thickness NiCrlNx 8A Silver 1200k NiCr "4x 2-8 A
SiNx
100 A
Rate 0.02-0.2 A/s 1.00 A/s
Target 80Ni 20Cr Silver
rf Power 20-100 W 100 W
0.02-0.2 A/s 0.16 A/s
80Ni 20Cr Silicon
20-100 W 200 W
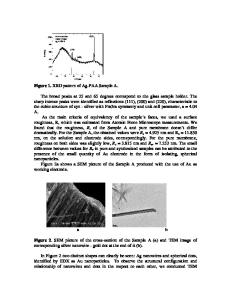
Some films were exposed to acid vapor to accelerate degradation. These samples were suspended in a closed container for 24 hours over a solution of Iml conc. HC1, 1 ml conc. H 2 SO 4 and 218ml of deionized water to give about pH 1. The solution was allowed to come to thermal equilibrium after mixing to prevent condensation onto the suspended samples. Electrochemical Impedance Spectroscopy (EIS) was performed on other samples in 0. IN NaCi in a Gamry Instruments Paint Test Cell. Data was collected with a Gamry Instruments CMS300 EIS System, which scans from high to low frequency. Specular reflection spectra were collected on a Perkin Elmer Lambda 9 Absorption Spectrometer as well as a SCI FilmTek 2000 Fiber Optic Reflectometer. RESULTS The reflection spectra of several samples are given in figure 1. Bare silver has a reflectivity of near 98% at longer wavelengths, decreasing dramatically below 400 nanometers. When 1O00A of SiNx is deposited on top of the silver film, the reflectivity is enhanced slightly above 380nm at the expense of reflectivity below 380nm. The addition of 2A of NiCrNx followed by SiNx causes a drop in reflectivity between 1% and 9%. To compensate for the absorption loss, a two layer dielectric layer (504 nm silica and 480 nm of titania) was added to enhance the short wavelength reflection at the expense of the long wavelength reflection. Samples with the reflectivity enhancement layers are notated by peAg. Notice that the films with the thicker NiCrNx interlayers show further reduced reflectivity. Several samples were exposed to acid vapor for 24 hours. Figure 2 shows the reflection spectrum of each sample before and after exposure. The silver film showed severe degradation. The film corroded unifo
Data Loading...