Optical Spectroscopy of Pentavalent Chromium Ions in Glass
- PDF / 354,983 Bytes
- 6 Pages / 414.72 x 648 pts Page_size
- 84 Downloads / 305 Views
Mat. Res. Soc. Symp. Proc. Vol. 455 0 1997 Materials Research Society
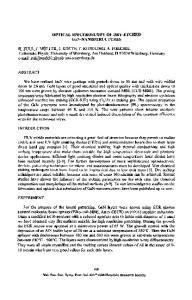
For photoluminescence measurement, the sample was mounted onto the cold finger of a closed-cycle cryo-refrigerator and pumped by emissions of a Spectra-Physics model-2040E cw Argon laser. For time-resolved fluorescence and decay process measurements, a homemade dye laser pumped by a Quanta-Ray DCR 210 Nd:YAG pulse laser was used. A Spex 1401 double spectrometer equipped with R943 PMT was employed to detect emission. The cw signal was analyzed through a photon counter SRS-400. The decay process was recorded by a SRS-430 multichannel scaler. For time-resolved fluorescence measurements, a SRS-250 boxcar averager was used for the fast-decay component, while a gated photon counter was used for the slow-decay component. All the spectra have been corrected by the spectral response of the system. EXPERIMENTAL RESULTS As mentioned before, the glass sample contains Cr4', Cr5" and Cr6 . The absorption from 520 nm to the near infrared and the fluorescence in the infrared range originating from Cr 4' have been well studied in a similar glass sample [8] from Coming and will not be discussed in this letter. The absorption spectrum of this sample has an intense band peaked at 370 nm with a long shoulder extending to 500 nm. The source of the absorption is still uncertain, but absorption maxima at this wavelength in Cr-doped alkali silicate glasses have been attributed to Cr 6+ [9]. Fig. 1 shows a broad band luminescence centered at approximately 780 am under cw pumping of an Ar laser. The spectrum spans over 5000 cm' with a full width at half maximum (FWHM) of 3500 cm'. It can be seen that the luminescence is shifted to the red on increasing the pumping wavelength from 458 nm through 476, 502 nm to 529 rim. The spectral shifts indicate either a large inhomogeneous Cr site distribution or the existence of multiple optical centers. In addition, a weak emission peak at 550 am was also observed, the intensity of which increases when the pumping wavelength is longer. 100 10
).106
8
"//i 2
o
b
O10, 104
0
500
80o
700
800
Wavelength (nm)
0
900
Figure 1. CWluminescence spectra at 12K pumped by different Ar laser lines: (a) 458nm, (b) 476nm, (c) 502nm and (d) 529nm.
1000 2000
3000
Time (ý.s)
4000
5000
Figure 2. Luminescence decay curve at 12K, excited at 449nm, monitored at 714nm.
484
The decay of the luminescence was measured at 714 nm and is shown in Fig. 2. The decay curve is not of a single exponential funtion. It consists of two major components: a fast one and a slow one. The fast component has a large initial intensity and a typical decaytime of 1.1 ps. The slow component has a typical decaytime of 1.3 ms. A difference of three orders in the lifetimes indicate that two active centers in the glass are involved in the broad band emission. In order to separate the luminescence band from each optical center, time-resolved luminescence was measured, and the results are shown in Fig. 3. The pumping dye laser was set at 443 am with a pulse width o
Data Loading...