Oscillations
A new branch of solar research has been developed since 1975, when it was discovered that the photospheric periodic motions previously known as “5-minute oscillations” have a spectrum of discrete frequencies. A large number of such modes, with periods in
- PDF / 1,301,560 Bytes
- 55 Pages / 439 x 666 pts Page_size
- 30 Downloads / 367 Views
A new branch of solar research has been developed since 1975, when it was discovered that the photospheric periodic motions previously known as “5-minute oscillations” have a spectrum of discrete frequencies. A large number of such modes, with periods in the range 2–15 minutes, have been observed. They are identified as acoustic waves, or p modes, where the pressure gradient is the main restoring force. The discrete mode pattern is a consequence of reflecting boundaries and can be used to obtain information about the Sun’s interior. Gravity provides the restoring force for a second type of oscillation, with lower frequencies. These internal gravity modes depend on a stable stratification: they are supported by the radiative interior of the Sun, with a discrete spectrum of g modes, which, however, has not yet been confirmed by observation; on the other hand, there are hints that they exist above the convection zone in the stable solar atmosphere.
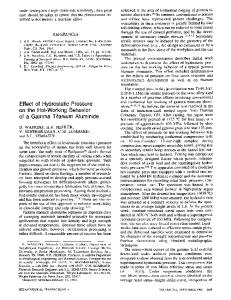
5.1 Observations 5.1.1 Five-Minute Oscillations Oscillatory motions in the solar atmosphere were discovered in 1960 by a spectroheliographic technique (Leighton et al. 1962; cf. Sect. 3.4.7): Two spectroheliograms recorded simultaneously in the red and blue wings of a spectral line are photographically subtracted. The result is a “Doppler plate”; its intensity variation has its origin in the local Doppler shift of the line used. Two such Doppler plates, obtained by scanning the Sun first in one and immediately afterwards in the opposite direction, are then again subtracted from each other. Since each scan takes a few minutes, the resulting “Doppler difference” has a variable time delay Δt between the two constituent Doppler plates: Δt is smallest at the edge where the scanning direction was reversed and increases linearly from there. A periodic velocity field on the Sun manifests itself as a periodically changing intensity contrast on such a picture. Figure 5.1 shows a nice example.
M. Stix, The Sun © Springer-Verlag Berlin Heidelberg 2002
182
5. Oscillations
Fig. 5.1. Dopplerdifference plate for the Ba II line λ = 455.4 nm. From Leighton et al. (1962)
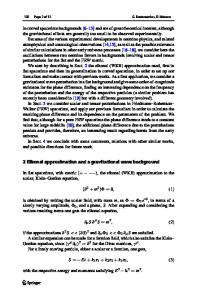
Fig. 5.2. Spectrum and velocity curves for the lines Mg b2 and Ti I λ = 517.37 nm, obtained at Sacramento Peak Observatory. The arrows indicate the velocity in km/s and the distance on the Sun in km. From Evans and Michard (1962)
5.1 Observations
183
Problem 5.1. How does the contrast pattern of Fig. 5.1 change if the two Doppler plates are added instead of subtracted? The 5-minute oscillations which are visible in the Doppler-difference plates were further investigated mainly by direct measurement of the local Doppler shift of spectral lines (Fig. 5.2). Observations made at various places between disc center and the limb show that the motion is predominantly vertical (e.g., Schmidt et al. 1999). The amplitude, typically 0.5 to 1 km/s, slightly increases with height in the atmosphere, as one can see from the analysis of lines originating in different heights. In addition to the Doppler shift a periodic variation of the line
Data Loading...