Overlapping Magnetic Activity Cycles and the Sunspot Number: Forecasting Sunspot Cycle 25 Amplitude
- PDF / 2,929,669 Bytes
- 14 Pages / 439.37 x 666.142 pts Page_size
- 62 Downloads / 267 Views
Overlapping Magnetic Activity Cycles and the Sunspot Number: Forecasting Sunspot Cycle 25 Amplitude Scott W. McIntosh1 · Sandra Chapman2 · Robert J. Leamon3,4 · Ricky Egeland1 · Nicholas W. Watkins2,5,6
Received: 25 August 2020 / Accepted: 17 October 2020 © The Author(s) 2020
Abstract The Sun exhibits a well-observed modulation in the number of spots on its disk over a period of about 11 years. From the dawn of modern observational astronomy, sunspots have presented a challenge to understanding—their quasi-periodic variation in number, first noted 175 years ago, has stimulated community-wide interest to this day. A large number of techniques are able to explain the temporal landmarks, (geometric) shape, and amplitude of sunspot “cycles,” however, forecasting these features accurately in advance remains elusive. Recent observationally-motivated studies have illustrated a relationship between the Sun’s 22-year (Hale) magnetic cycle and the production of the sunspot cycle landmarks and patterns, but not the amplitude of the sunspot cycle. Using (discrete) Hilbert transforms on more than 270 years of (monthly) sunspot numbers we robustly identify the so-called “termination” events that mark the end of the previous 11-yr sunspot cycle, the enhancement/acceleration of the present cycle, and the end of 22-yr magnetic activity cycles. Using these we extract a relationship between the temporal spacing of terminators and the magnitude of sunspot cycles. Given this relationship and our prediction of a terminator event in 2020, we deduce that sunspot Solar Cycle 25 could have a magnitude that rivals the top few since records began. This outcome would be in stark contrast to the community consensus estimate of sunspot Solar Cycle 25 magnitude. Keywords Solar cycle, observations · Interior, convective zone · Interior, tachocline
B S.W. McIntosh
[email protected]
1
National Center for Atmospheric Research, High Altitude Observatory, P.O. Box 3000, Boulder, CO 80307, USA
2
Centre for Fusion, Space and Astrophysics, University of Warwick, Coventry CV4 7AL, UK
3
Goddard Planetary Heliophysics Institute, University of Maryland–Baltimore County, Baltimore, MD 21250, USA
4
NASA Goddard Space Flight Center, Code 672, Greenbelt, MD 20771, USA
5
Centre for the Analysis of Time Series, London School of Economics and Political Science, London WC2A 2AZ, UK
6
School of Engineering and Innovation, STEM Faculty, The Open University, Milton Keynes, UK
163
Page 2 of 14
S.W. McIntosh et al.
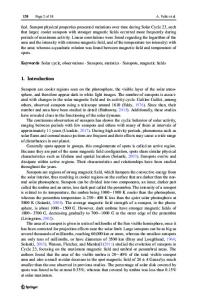
Figure 1 The monthly sunspot number since 1749. The data values are represented by dots and the 12-month running average values are illustrated as a red shaded area. The sunspot cycle numbers are shown in the shaded area—number 1 starting in the 1755 and number 24 presently drawing to a close. Also shown in the figure are a set of vertical blue dashed lines that signify the magnetic activity cycle termination times that trigger the rapid growth of sunspot activity (McIntosh et al., 2019). The sunspot data used here are freely available and pr
Data Loading...