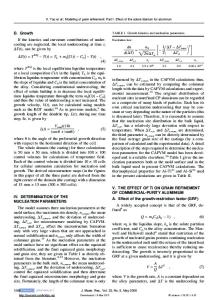
Oxygen incorporation in aluminum nitride via extended defects: Part I. Refinement of the structural model for the planar
- PDF / 9,820,770 Bytes
- 17 Pages / 581 x 791 pts Page_size
- 22 Downloads / 280 Views
Robert A. Youngman Carborundum Microelectronics Company, 10409 S. 50th Place, Phoenix, Arizona 85044
Martha R. McCartney Center for Solid State Science, Arizona State University, Tempe, Arizona 85287
Alastair N. Cormack New York State College of Ceramics, Alfred University, Alfred, New York 14802
Michael R. Notis Department of Materials Science and Engineering, Lehigh University, Bethlehem, Pennsylvania 18015 (Received 2 June 1994; accepted 24 January 1995)
The model proposed by Harris et al. [J. Mater. Res. 5, 1763-1773 (1990)], describing planar inversion domain boundaries in aluminum nitride, consists of a basal plane of aluminum atoms octahedrally coordinated with respect to oxygen, and with a translation of R = l/3(10ll) + l/30 indicates that no difference could be seen in the image characteristics of the two simulations over a wide range of defocii and thicknesses; see Figs. 9(a) and 9(b). According to Saxton and Smith,65 it is possible to determine atomic positions using HRTEM to within 14 pm (0.014 nm); this requires a through-focal series reconstruction of the experimental images. In the present case, the difference in c-axis displacement vector components, 0.333(0001) and 0.387(0001), corresponds to 26 pm (0.026 nm). This is near the limit of atomic position determination using HRTEM, as suggested by Saxton and Smith.65 Therefore, it appears that it is not possible to determine unambiguously the small differences between these two models using HRTEM. C. Analytical electron microscopy (AEM) For a full account of the experimental AEM work, the authors refer the reader to Westwood et al.22'24 The oxygen concentration profiles obtained across the planar IDB are presented in Figs. 10(a) and 10(b). In each case, oxygen segregation was found to be limited within a very narrow region, with maximum concentrations of 6.5 ± 0.9 wt. % [Fig. 10(a)], and 6.0 ± 0.8 wt. % [Fig. 10(b)]. Both these profiles were obtained from different IDB's in a region 110 nm thick. There appears to be an oxygendepleted region extending out to 20 nm on either side of the IDB. The matrix oxygen concentration on either side of the IDB appears to be asymmetric once outside of the oxygen-depleted zone. At random locations along the IDB, small amounts of calcium were detected; calcium is an impurity present in the starting A1N powder. When a number of other data points that were not part of the profile were taken from locations along the IDB interface, they revealed small fluctuations in the oxygen concentration. Table II provides all the experimentally determined oxygen concentration data obtained 1280 http://journals.cambridge.org
FIG. 8. A HRTEM image of the interface with a simulated image based upon the refined planar IDB model with the adjusted c-axis displacement vector, R = l/3 + 0.333(0001} Youngman45 IDB
0.165
AI3O3N
6.7
7.7
R = l/3(10T0) + 0.333(0001} Westwood59 IDB
0.192
AI3O3N
7.1
8.1
R = l/3 + 0.387(0001} Westwood59 IDB
0.192
AI2O3
8.2
9.5
R = l/3(10T0> + 0.387(0001}
IDB: the effect of aluminum vacancies, the
Data Loading...