Photoluminescence Characteristics of HF-Treated Silicon Nanocrystals
- PDF / 350,900 Bytes
- 6 Pages / 412.92 x 646.2 pts Page_size
- 15 Downloads / 338 Views
Mat. Res. Soc. Symp. Proc. Vol. 452 01997 Materials Research Society
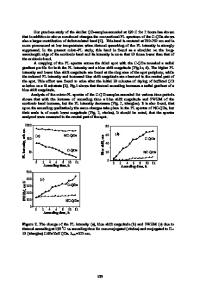
nanocrystals by the gas-evaporation technique. After this HF treatment, the samples were blown dry in N 2 flow. The chemical analyses were made by x-ray photoelectron spectroscopy (XPS) and Fourier-transform infrared spectroscopy (FTIR) with an ESCA-K1 (Shimadzu) and a Spectrum 2000 (Perkin Elmer), respectively. The PL measurements were carried out at room temperature with the 313 nm line selected from the incident light of a mercury lamp as an excitation source using an optical band-pass filter. RESULTS AND DISCUSSION The average size of the Si nanocrystals estimated from the width of the x-ray diffraction peaks is 3.5 nm, which is consistent with the size determined by transmission electron microscopy (TEM). The size and its distribution are much smaller and narrower, respectively, than those of the Si nanocrystals deposited in an argon (Ar) atmosphere [5], as expected from a study of metal particles deposited in Ar, He and xenon (Xe) atmospheres [7]. Figures 1 (a) and (b) show the Si2p XPS spectra of the samples before and after the HF treatment, respectively. The depth profiles of the spectra were measured after sputter-etching by Ar ion bombardment (2 kV, 20 mA) for various periods of time as indicated in the figures. It is noted that the as-deposited Si nanocrystals contain a large amount of native oxide, while the sample which was dipped in the HF solution shows no trace of oxide. However, it should be pointed out that the Si nanocrystals deposited in an Ar atmosphere contain a larger amount of native oxide and are hardly left after the HF treatment. Less natural oxidation for a He atmosphere can be understood by the experimental finding that the oxidation rate of the smallersized Si nanocrystals was less [8].
Si
2
,
Si
Si
Si
0Osec
I. ,
0 ..
~~
isec se
415
60 sec. 75 se
C
100
sec
9011)100 1
105ClOse sec
120 sec
1isec
135ee
10150
100
sec
110
90
10
100
Binding Energy (eV) (b)
Binding Energy (eV) (a)
Fig. 1. Si2p XPS spectra of (a) the as-deposited and (b) HF-treated Si nanocrystals. In (b) the measurement was carried out immediately after the HF treatment. The XPS spectra were collected after sputter-etching for various periods of time as shown in each spectrum.
160
The FTIR spectra of the Si nanocrystals measured after the HF treatment are shown in Fig. 2. Prior to the measurements, the samples were left in the air for various periods of time. Both SiHn - and SiO-related peaks are extremely small immediately after the HF treatment (spectrum (a)) and gradually grow with time. The intensities of the SiH 2 scissors and Si-H stretching modes at 910 and 2100 cm-1, respectively, saturate 30 min after the HF treatment (spectrum (b)), while that of the Si-O-Si asymmetric stretching mode at 1068 cm-1 continues to increase even 60 min after the HF treatment (spectra (c) and (d)). A small amount of H atoms at the surface present immediately after the HF treatment is rather surprising, and it suggests that the passiva
Data Loading...