Plastic deformation of delta-ferritic iron at intermediate strain rates
- PDF / 609,681 Bytes
- 7 Pages / 612 x 792 pts (letter) Page_size
- 38 Downloads / 430 Views
p e c i m e n s with a d i a m e t e r of 3.2 m m and a gage length of 37 m m w e r e s t r a i n e d i n a c o m m e r c i a l l y a v a i l a b l e v a c u u m f u r n a c e . An a r g o n a t m o s p h e r e at 13 P a was m a i n t a i n e d in the f u r n a c e d u r i n g a test in o r d e r to m i n i m i z e the e v a p o r a t i o n of the s p e c i m e n . The s t a n d a r d a n n e a l i n g t r e a t m e n t was 10 m i n i m m e d i ately p r e c e d i n g d e f o r m a t i o n at the s a m e t e m p e r a t u r e . D e f o r m a t i o n of the s p e c i m e n s was achieved with the c o n s t a n t s t r a i n - r a t e m a c h i n e used for the t e s t i n g of austenitic iron.x~ Strain rates less than 2 • 10.5 s-I were generally avoided because the stresses approached 0.17 MN/m2 (25 psi) and the corresponding forces, as low as 1.33 N (0.3 Ibf), were difficult to measure accurately. In addition, for the long times involved at very low strain rates, evaporation losses become appreciable. Stress-strain data were derived from the forcetime curves. For the assumed condition of strain rate being independentof strain, the true strain, s is proportional to time. The true stress was calculated as F (expE)/Ao, where F is the measured force and Ao is the initial cross-sectional area. RESULTS
EXPERIMENTAL PROCEDURE AND APPARATUS
Effect of S t r a i n Rate
The chemical analyses of the electrolytic iron, the iron-carbon alloys, and the Fe-3.0 Si alloy are given in Table II. The electrolytic iron and the Fe-0.044 C alloy were used previously in the tension testing of austenitic iron.x Button-head type cylindrical tension
Table I. Investigations of the Plastic Deformation of Delta-Ferritic Iron Reference
Material
Nominal Strain Rate, s-1
Temperature, ~162
3 4 5 6 7 8
Fe Fe Fe-3Si Fe-3.2Si Fe-3.5Si Fe-4Si
2.2 X 10 -s- 1.4 X 10 -7 < O* 1.4 X 10 -8 - 2.2 X 10 -7 < 2 X 10 -s ( lO -7 < 2 X 10 -s
1515 1440 1275 to 1475 1120 to 1405 ? 1200 to 1350
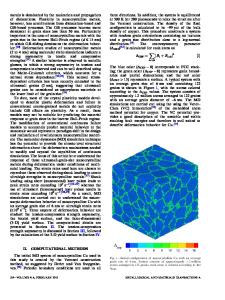
The m o s t c o m p l e t e set of r e s u l t s was obtained for the F e - 0 . 0 2 8 C alloy at 1425~ and the s t r e s s - s t r a i n c u r v e s for d i f f e r e n t s t r a i n r a t e s a r e p r e s e n t e d in F i g . 1. S t r e s s i s plotted on a l o g a r i t h m i c s c a l e b e c a u s e of the l a r g e r a n g e involved. The r e s u l t s i n d i c a t e how s m a l l is the flow s t r e s s of d e l t a - i r o n ; even at the r e l a t i v e l y high s t r a i n r a t e of 2.3 • 10 -2 s -1 the m a x i m u m s t r e s s is l e s s than 2.07 MN//m 2 (300 psi). With a r e d u c t i o n i n s t r a i n r a t e of t h r e e o r d e r s of m a g n i tude. the m a x i m u m s t r e s s i s r e d u c e d to about 0.22 MN//m e (32 psi). The strain-rate dependenceof the flow stress is further illustrated in Fig. 2 for the same Fe-0.028 C
Table II. Chemical Composition of Materials
*The axial contraction of thin-walled cylindrical specimens produced negative strain rates.
PETER J. WRAYis Associate Research Consultant, Mechanical Science Division,U.S. Stee
Data Loading...