Scaling Behavior of the Complex Conductivity of Graphite-Boron Nitride Percolation Systems
- PDF / 313,498 Bytes
- 6 Pages / 414.72 x 648 pts Page_size
- 70 Downloads / 301 Views
ed by the actual measured am(4),0) results and the
353
, axis so as to form a continuous curve which fitted onto or close to the curves as shown. The distance the results had to be scaled along these axis enabled (o.+ and (o, to be calculated.
/1'
3
2
1o0-
FF,
LF
0.
0-
.50
.40
-30
-20
-10
LOG10
00
1-
10
20
- . E W./-,-
30
40
s0
)
-4
-140-120-100 -00 -60 -40 .20 00 LG10G
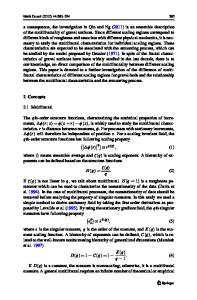
Fig. 2a. Plots of ai ( (4,0) 4),1)/am agis +wC (co/Co..). against o/o,0 (eagainstThe experimental data is from Fig. Ia and the origin of the F+ (F.) line is discussed in the text.
20
40
60
80
100 120 k
& -/-_)
Fig. 2b. Plots of ami (4),o)/4)m (4),0) co/O). (co/-o+). The experimental data is from Fig. lb and the origin of the F- (F+) line is discussed in the text.
Figure 3 shows a plots of (o,+ the measured DC conductivity for the discs, 50%G and 55%G powders, which according to eqn. (4) should all have a slope of(t+s)/t. Also shown are the co0 +values calculated from eqn. (4) using using both the measured value of am (4),0) and the parameters used for the calculated curves in Figs. 2 a and b. The experimental slopes are (q=1.03, 0.84, 0.82 ) and there is clearly a disagreement as the slopes (q) of the experimental co,+ curves are less than the ones calculated from the measured DC conductivity and 1/u from AC experiments. In the case of the powders an even more alarming difference is the fact that the o)o+s differ by more than an order of magnitude. Other workers who successfully scaled their AC conductivity results [8-10], but did not independently measure s and t, also obtained a slope from their (0+ against Oin(4,0) plots, less than their measured values of 1/u=(s+t)/t, but did not comment on the fact that their measured values of co+are very different in magnitude from the calculated ones. Huntley and Zettl [8] obtained a q of 0.82 for, presumably 2d gold films, while Benguigui [9] and Chakrabarty et al[ 10] both obtained q= 1.1 for mixtures of glass and iron balls and carbon
wax mixtures respectively. Plots of co. against a a.(4,0) calculated from eqn. 1 and the parameters previously used also gave slopes for q (1.16, 1.07 & 1.14), also lower than the calculated ones (1.20,1.15, & 1.06). These slopes differ from each other by less than in the previous case. Unfortunately there was still a large difference in the magnitudes of the measured and
354
calculated Co,. values. The only other person to scale his aj or e.. results was Benguigui [9]. Unfortunately his system of glass and iron balls was not large enough (did not contain enough particles) to obtain reliable results near 4), where there is a diverging coherence length [1-3] . Therefore we believe that these results are the most complete and reliable ones yet measured. zIatec
(Xzisk
zisk 71eAsurec 5c,05,% G ,m eas ure d .1 -5-%-.3 ma'osureo
Fig. 3. Plots of the log of the experimentally measured and calculated values of o 0+/2iragainst the measured value ofam (+),0). [ x disc -calculated =1.2, 0 disc -measured = 1.03, LI55%Gcalculated = 1.05, 455%G -me
Data Loading...