Shape Memory Effect and Pseudoelasticity in Ti-40%Ni-10%Cu (At.%) Single Crystals
- PDF / 301,132 Bytes
- 6 Pages / 414.72 x 648 pts Page_size
- 16 Downloads / 380 Views
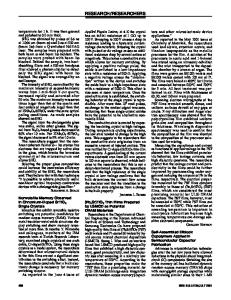
during 24 hr., fast cooling in furnace. RESULTS AND DISCUSSION It has been experimentally shown by electric resistivity p(T) measurements that for crystals B (fig. lb) for the first transformation B2-B19 Ma=293 K, Mf'=268 K, A.=275 K, Af=313 K; for 2 the second transformation B19-B19' MW =263 K, M2=161 K, A,2=175 K, A2=270 K. The use of this method for precise determination of MK, Mf, Af, Af is limited by low sensitivity of electric resistance to the formation of orthorhombic phase B 19, while B 19-B 19' transformation is accompanied by the significant change of resistance. For crystals A the distinguishing of two transformations through the change of p(T) is difficult (fig. Ib). MT temperatures in single crystals appears to be shifted to the lower temperature range as compared with data over polycrystals [1-3], which is related with the change of titanium concentration during growth. The dependence ac,(T) in single crystals is typical for materials undergoing MT and appears to be analogous to that found earlier [1] on polycrystals (fig. 1). In high temperature B2 phase oF, depends on crystal orientation, sign of applied stresses (tension/compression) and heat treatment, Crystals A in any orientation have lower o,, than B and this is crucial, as will be proved below, for creation of proper conditions for PE. Under the same heat treatment, for example B, (fig. 1) orientations are "soft", possessing lower a•, while , ones are "hard". 401
Mat. Res. Soc. Symp. Proc. Vol. 459 0 1997 Materials Research Society
0. (iP
j.og 1.09
4 Ue
1.0
0
173
Z73
375
43 TKA
Fig. 1 The dependence of a,,and the electric resistivity of the Ti-40at.%Ni-Oat.%Cu single crystals on the test temperature.
402
Regardless of the way of heat treatment the phenomena of asymmetry have been found inB2 phase: dependence of u., on the sign of applied stress (tension/compression). Crystals of "hard" orientation in tension are characterized by low plasticity and brittle fracture, in
Fig.2 The tension/compression flow curves of the Ti-40at.%Ni-10at.%Cu single crystals at the different test temperatures (crystal B).
403
compression deformation occurs by kinking bands. "Soft" orientations are plastic, being intermediate ones. The strong orientation dependence and asymmetry of a,- in B2 phase determine the temperature interval of stress-induced MT AT,,, dependence c,, PE. In low strength crystals after treatment A no PE was observed in any orientation, while in crystals treated by B way high strength properties of B2 phase promote PE in "hard" orientations , in tension and compression at T>Af in narrow temperature interval, no PE having been found in "soft" orientation (Fig.2). Rise of arc level leads to widening of interval of stress induced MT AT,. The SME depends on orientation and sign of applied stress (table) and after B treatment appears to be slightly lower than after A one. In compression SME is lower than in tension, and reaches maximum magnitude in tension , crystals, being smaller in (table). TABLE The dependence of maximum magnit
Data Loading...