SIMS and CL Characterization of Manganese-Doped Aluminum Nitride Films
- PDF / 1,540,239 Bytes
- 6 Pages / 417.6 x 639 pts Page_size
- 74 Downloads / 386 Views
13 Mat. Res. Soc. Symp. Proc. Vol. 572 ©1999 Materials Research Society
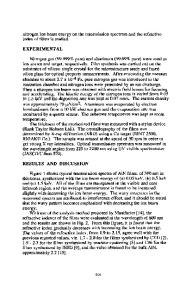
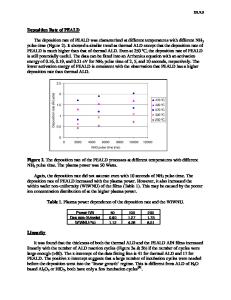
nitride ceramicwas heater and held in holder place byto adetermine molybdenum metal holder. A nichrome thermocouple attached to the the temperature during the deposition period. Pressures in the chamber were monitored with an ion gauge. The Si(100) substrates were flash annealed above 1200 °C to remove the surface oxide coating. The substrates were then kept at a constant temperature around 860 °C [9]. A stoichiometric ratio of2.5:1 NH3 to TMA was used for growing A1N films. Manganese decacarbonyl, ([Mn(CO)5]/), the dopant, was introduced into the flow reactor via a pulse valve. These films were characterized ex situ with IR reflectance microscopy, SEM imaging, XRF, XRD, CL, and SIMS. RESULTS With the use of IR microscopy, film thickness was determined by measuring the fringe spacing of the Fabry-Perot oscillations, while the chemical composition was analyzed by monitoring the peak frequency and bandwidth of the LO mode (880 - 935 cm-1). The sharpness of LO mode observed in most of the films is related to the degree of crystalinity in the film [10]. The relatively fast growth rates (3-5 •m per hour) produced multiple nucleation centers that lead to a very rough surface. The film thickness ranged from 2 •m up to 27 ktm. Many samples show incorporation of manganese during the growth of A1N films. These films show light emission during electron bombardment (cathodoluminescence). The film referred to as sample 0209 is 12.18-•m thick, and its manganese content relative to aluminum is less than 0.1%. The CL spectrum of this film collected at room temperature exhibits few emission bands as shown in Figure 1. First amongst these bands is a slight shoulder that corresponds to an emission at 23419 cml (427 nm). It is followed by a green band at 20491 cm-1 (488 nm), and then a red band at 16667 cm1 (600 nm). The red band possesses multiple phonon states that have been described earlier by Karel and coworkers [7]. Figure 1 also includes the results of the curve fitting procedure in order to help locate the position of the multiple emission bands. Although these transitions have been shown to originate from Mn4+ ions in a tetrahedral field [7], only the emission from the red band has been observed previously. The blue and green transitions were observed only in the excitation spectrum.
SOriginal S..... Blue
S.... S-•. S.......
11000
Green Red Fitted
17000 23000 29000 Wavenumbers (cm 1)
35000
Figure 1. Deconvolved spectra and original spectrum for sample 0209.
414
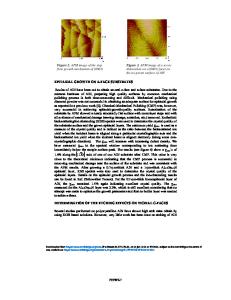
A full characterization of sample 1020 was also carried out. The film had an overall thickness of 6.0 ptm as calculated from IR reflectance microscopy data. In this sample, a manganese activated AIN layer (overlayer) was grown on top of a pure AIN layer. SEM was used to clarify the morphology of the films. At 8000 times the magnification, the two film layers showed different structure. Figure 2 (panel a) displays an SEM image of the overlayer that exhibits a grain like appearance. Panel b
Data Loading...