Solid State Reaction of Al and Zr in Al/Zr Multilayers: A Calorimetry Study
- PDF / 1,299,369 Bytes
- 6 Pages / 414.72 x 648 pts Page_size
- 15 Downloads / 309 Views
substrate and the thinnest section is on the outer edge of the substrate. All measurements reported here were performed on 47pgm thick foils with a 427A period. Based on a calibration of deposition rates and a wet chemical analysis of a similar Al/Zr multilayer sample, the composition of this sample was determined to be 25.4 atomic % Zr with an expected experimental error of 5% (±1.3 at %). All thermal measurements were made with a Perkin-Elmer DSC7 system. Pieces of the foils were cut, weighed, and crimped in aluminum or copper pans, and then purged with Ar gas in the DSC sample chamber before heating. The isochronal scans were performed at a heating rate of 250 per minute with a maximum temperature of 725°C [9]. For the isothermal tests, samples were heated at 1000 per minute to the hold temperature and then a constant temperature was maintained for 120 minutes. In both the isochronal and the isothermal tests, a baseline for subtraction was determined by repeating the temperature cycle with the same heating parameters. XRD characterizations were performed with a Scintag diffractometer and software. The machine was calibrated using a silicon powder standard. The widths of the silicon peaks were determined as a function of 20, and the full widths were attributed to machine broadening effects based on the size of the Si crystallites (30 Igrm). This calibration permitted the determination of layer thicknesses using Al and Zr peaks widths and the Scherrer Equation [10]. To identify the products of the SSRs, samples were heated beyond an exotherm in the DSC and then quenched. Cross-sectional transmission electron microscopy (TEM) was also used to examine the structure and layering in the foils.
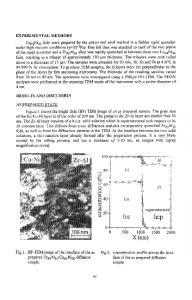
RESULTS The as-deposited multilayer samples consist of highly textured, alternating layers of polycrystalline Al and Zr. Figure 1 shows a cross-sectional TEM micrograph of a 47 gm thick multilayer foil, and Figure 2 shows results from a symmetric XRD scan of the foil. The asdeposited sample (Figure 2) shows 4 main peaks: 34.8* (Zr (002)), 38.40 (Al (111)), 73.5" (Zr (004)), and 82.40 (Al (222)), verifying that the multilayers are textured with the FCC Al and HCP Zr close-packed planes lying in the plane of the foil. High resolution TEM verified that thin amorphous Al-Zr reaction layers form at the Al/Zr interfaces during deposition [11].
1600
.81000 8600
Heated to 7250 in DSC
200
As-Deposited 0
m
Cross-sectional TEM micrograph of an as-
Figure 1: AI/Zr multilayer sample deposited
3
40 50
60 70
80 90 100
2 Theta (Degrees) sc eti (De 2 F Figure 2: Data from symmetric XRD scans of as-
f
deposited and heated (725'C) Al/Zr multilayer samples
Three different exothermic reactions were observed in the heat flow data when these samples were isochronally scanned to 725°C (Figure 3). The final products of the three reactions are predominantly tetragonal A13Zr with some hexagonal Al2Zr, based on XRD scans and TEM
analysis [11]. The heat for the first, large exotherm at 358°C was 777 J/g while the total heat of all three exot
Data Loading...