Structural and Optical Properties of Co-doped HfO 2 Multi-layer Deposited by Spray Pyrolysis Technique
- PDF / 395,234 Bytes
- 8 Pages / 612 x 792 pts (letter) Page_size
- 49 Downloads / 351 Views
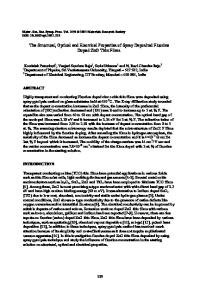
1. HfO2/SiO2 with rare earths dopants multi-layer structure diagram performed on a silicon substrate.
Experimental Setup Thin film thickness and refractive index were determined by spectral ellipsometry, with a UVISEL ellipsometer operating in the 275 to 827 nm wavelength range. Chemical composition was obtained by means of Energy Dispersive X-ray Spectroscopy (EDS) measurements using a Cambridge-Leica Stereoscan 440 Pentatet Oxford model, with X-ray detector XPI-138-10EDS model provided with a beryllium window. Oxidation Hf species was measured by X-ray
photoemission (Thermo Scientific monochromatic Al K-alpha source of 1486 eV; ≤ 6 mm spatial resolution). AFM (Jeol JSPM-4210 silica ends Mikro Masch NSC15 with curvature radii < 10 nm) images were obtained to measure roughness surface of HfO2 thin films. The photoluminescent (PL) measurements were obtained by means of a spectrofluorometer (SPEX Fluoro-Max-P model), by changing the excitation wavelength for each one of the different rare earth ions: λ exc (Eu): 251 nm; λ exc (Tb): 291 nm; λ exc (Tm): 395 nm. Finally, HRTEM analysis was made using an Atomic Resolution Microscope ARM200F JEM model coupled to a CCD detector. RESULTS The thickness of each HfO2 thin film as a function of substrate temperature is shown in Table I. The refractive index obtained was 2.1 for HfO2 thin films with and without dopants. Main properties of SiO2 thin films are: refractive index of n SiO2 = 1.45 to 1.47; amorphous (independent of substrate temperature); 50 nm thickness, and roughness ≤ 10 Å. Table 1. Representative thin film thickness, respect to several temperatures and times of synthesis.
Time (min) / Temp.(ºC) 0.5 1 2 5 10
400 20 nm 42 nm 107 nm 230 nm 492 nm
450 25 nm 47 nm 114 nm 234 nm 494 nm
500 27 nm 53 nm 117 nm 245 nm 501 nm
550 28 nm 55 nm 129 nm 255 nm 505 nm
Table II shows the atomic concentration of present species in HfO2 thin films for several deposition conditions, carried out by EDS measurements. The deposition temperature seems does not significantly affect these atomic percentage; for these reasons the table II only shows results for those samples deposited at 500º C. Table II. Concentration ratio of different elements found in samples practically constant in samples deposited at several temperatures substrate.
Element Atomic % Oxygen 81.2 Hafnium 15.5 Thulium 1.0 Europium 3.3 Terbium 1.8 Figure 2 presents the XPS spectra of the multi-layer structure, with the oxidation species formed in the sample. The tree rare earth ions peaks (Eu3+, Tb3+, and Tm3+) were obtained as function of the binding energy with Hf, and some with ozone (O3); the peak in 531.01 eV (with the highest intensity) corresponds to Eu+23dO3 oxidation specie; Tm4d-HfO2 oxidation species were found in 530. 14 eV and 539.39 eV [28]. These measurements were taken over tree different zones (zone 01, zone 02, and zone 03), showing a suitable homogeneity in the oxidation species formation in HfO2 thin films.
Figure 2. The main oxidation species, found in the XPS spectra, were those dominate
Data Loading...