Structure-Optical Property Relationships of Porphyrins
- PDF / 275,196 Bytes
- 6 Pages / 414.72 x 648 pts Page_size
- 54 Downloads / 310 Views
Mat. Res. Soc. Symp. Proc. Vol. 479 ©1997 Materials Research Society
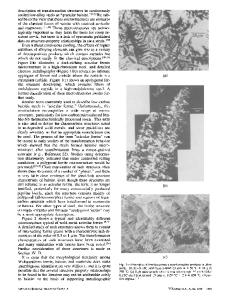
TABLE I PORPHYRINS SYNTHESIZED TO DATE 72 R4
1
,
8
R2
MN
3
6 5 Compound
Metals
I
Free Base, Cd, Co, Cu, Pb, Zn
Na 4 R 1, R 3
Free Base, Cd, Co, Cu, Pb, Zn
R 2, R 4 Si(CH3 )3
Free Base, Cd, Co, Cu, In, Pb, Zn
-
IV
Free Base, Pb, Zn
ci
ci
ci
ci
V
Free Base, Cd, Co, Cu, Pb, Zn H
VI
Free Base
IIa
z.
Si(CH3 )3
C-C
C_
-CH
3
H VII
Free Base, Cd, Co, Cu, Ni, Pb,
Zn
Br Br
VIIIa
Free Base, Cd, Co, Cu, Pb, Zn
IXb Free Base H H xc Free Base, Zn, Pb H H aBr atoms at positions 1-8. bpositions 1,3,6,7 = CH 3 ; positions 4,5 = CH 2 CH 2 COOCH 3 ; positions 2,8 = H CPositions 1,3,6,7 = CH 3 ; positions 4,5 = CH 2 CH 2 COOCH 3 ; positions 2,8 = Br
314
Si(GH3)3
28
--
----
VII
IX
VI:
--. .. ..........-. .. . ..-----.. . .. . .. . .. . .. . ..----. .. . .. . .. . . .. . --------------------------------...
--------. ..... -- .......----...........---
Vill S 20
--- ----
"16 13
14
15
16
17
18
Q Band Energy(10 cmn'
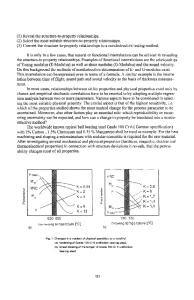
Figure 1. Plot of B 0-0 band transition energies vs. Q 0-0 band transition energies for free base porphyrins.
""
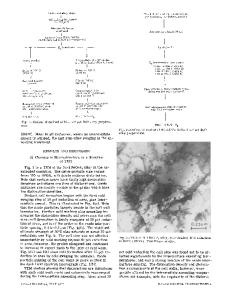
Slope = 0.97904 ........... ............ ........... I.................................. ----....................... ...................... .-.------22 .5 -.Intercept 6,595 cm-1 r 0.976C Cd22Cu
•
20.5
20 13.5
.-. .S+ . I. , Pb .... .... ... 14
14.5
I ....- . . ..15.5
15
16
Q Band Energy(10 3 cm"1 )
16.5
Figure 2. Plot of B 0-0 band transition energies vs. Q 0-0 band transition energies for a series of metal derivatives of porphyrin II.
315
16 14 12 B
10 8 B
6
C.-
4 2
C
0
I
. . . I
I
I
I
I
Free Base
Co
.
.
Si(CH 3) .
.
I I
I
Cu
Zn
,
,
Cd
,
,
( I
Pb
Metal
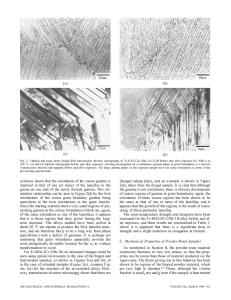
Figure 3. Plot of ratio of oscillator strength of B band to that of Q band as a function of metal for porphyrins I, II and VIII.
1
I
1
I
-
-"
ý
-
1-"""1 1
0.8 V C 0
-
"1
I
'
-"
"I"
CoBrTPP -
-
-
0.6
E C
0.4
Br~TI =
-_
- I.-BrTPPT--=- I
- -
0.2
-- ..
ZnBrTPP" ....
2. .. ..
010-3
10-2
10-
0. .
.. .
10
100
.
.. .
--1
2 - -• ,
102
3
103
Peak Fluence (j/cm2 ) Figure 4. Optical limiting curves for porphyrin VIII metal derivatives. BrTPP is free base porphyrin VIII. Optical limiting curve for C60 included for comparison.
316
Pump-probe Transient Absorption Cross Pol. rU. -,(
I
I
I
I
I
2.20 mJ/cm 2
I
0.6C:
0.5-
0
CD
E
........
-----. -----.. ............. L---------------• ----------.-...... --/------
0.4-
7.05mJ/cm 2
S. ...................... [--------------.. ................................. -.............-
---------... -----......... --..... ..... .......... . .... ........ / ........... !................ . :.......... ----..................
U-
0.3 •-
F_
0.20.1-
mm c at.. . 1.. .....................
Damage occured
. ... -. . ................. ------------------ -ZnBrTPP/Chloroform
lmm cell at 532nm
(A
-2
0
2
4
6
8
10
12
14
Time (ns) Figure 5. Pump-probe data for Zn-VIII at 532 nm.
Table II Excited State Parameters
Data Loading...