Study on the Concentration of a Silicon Oxide Micro-sphere on Modified Asphalt with SBS Copolymer
- PDF / 335,784 Bytes
- 5 Pages / 612 x 792 pts (letter) Page_size
- 48 Downloads / 272 Views
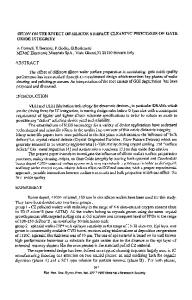
ION Figure 1 show the soft point a) and penetration b) as a function of the MS concentration (w/w %) of the investigated samples: These results indicate that, the presence of the MS particles increases the soft point thus the temperature resistance of the sample, while its penetration then toughness do not considerably changes.
The density and viscosity of the samples are respectively reported in Figure 2 a) and b); and it is apparent that density decreased while viscosity increased as the concentration of the MS was increased. The density decrease is explained assuming that MS was evenly distributed within the SBS-modified asphalt matrix, and considering the relatively small density of the MS in comparison to that of the SBS-modified asphalt: 0.25 g/cm3 and 1.1 g/cm3, respectively. For samples with up to 6 w/w % of MS seems to be a linear relationship between concentration of MS and density of the samples; On the other hand, samples having higher concentration of MS (8 and 10 w/w %) exhibited similar density, which could indicate that for such a composition the samples are close to a MS-saturation condition. Regarding the effect of MS concentration on viscosity, Figure 2 b) indicates that the amount of MS considerably increased the viscosity of the samples, it is also clear that within the shear rate investigated (10-1 – 102 sec-1) all samples exhibited shear thinning, which is an indication of the MS and SBS-modified asphalt matrix interaction, which is similar for all samples since all of them displayed similar slope. These results are explained taking into account that, in comparison to the other components of the blend, MS is a rigid material that is well distributed in the SBS-asphalt matrix, thus yielding some flow resistance for the sample, and this is an important factor for defining processing conditions for such a material [4]. 30
76
a)
b) 25
Penetration (dmm)
74
Soft point (°C)
72
70
68
20
15
10
5
66
0
64 0
2
4
6
8
10
0
Concentration MS (% w/w)
2
4
6
8
10
Concentration MS (% w/w)
Figure 1.- Soft point (a) and penetration (b) as a function of MS concentration. 2x100
b)
a)
1.1
Pa*s
(g/cm3)
100 1.0
0.9
0
2
4
6
8
Concentration MS (% w/w)
10
0% MS 2% MS 4% MS 6% MS 8% MS 10% MS
10-1
100
101
102
(s-1)
Figure 2.- Density (a) and viscosity-shear rate (b) as a function of MS concentration.
Table 2 displays the results for the modeling of some viscosity data (Figure 2b) through the models shown in Table 1; error in representing the experimental data as calculated with equation 1 are shown for three different blends. Sample nomenclature is as follows: A, SBS, and MS respectively represent asphalt, polymer, and microsphere of silicon oxide; the digit indicates the MS concentration of the sample (w/w %). Equation 1. Where E is the error, Ev the experimental value and Mv the model value. Table 2.- Errors for modeling of some experimental data using different viscosity models. Material Newton Bingham Casson Power law 7.62 1.38 1.64 A-SBS-MS-2% 9.56 5.29 4.0
Data Loading...