Sulfation of Y 2 O 3 and HfO 2 in relation to MCrAl coatings
- PDF / 684,743 Bytes
- 4 Pages / 612 x 792 pts (letter) Page_size
- 58 Downloads / 313 Views
n e v e r form. The value of the equilibrium SO3 partial pres-
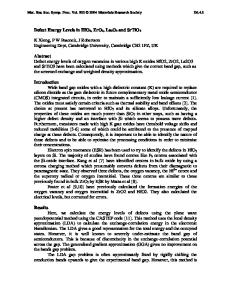
sure is a quantitative indication of the sulfation resistance of the oxide, and it can be determined experimentally by raising Pso3 in incremental steps, and observing when a weight c h a n g e o c c u r s . 9 A variation of the procedure 7 is to plot Pso3 vs weight gain for a given time period ( e . g . , 24 hours) for individual oxide samples exposed at increasing Pso3'S above the equilibrium partial pressure, and then to extrapolate to zero weight gain, as in Figures 2 and 3. Two difficulties arose in determining the equilibrium Pso3 for Y203 sulfation. First, Y203 proved so reactive with S O 3 that equilibrium Pso3 at 700 ~ was too low ( < 10-6 atm) to be measured in our system. Measurements were made therefore at 850 to 950 ~ but at these temperatures, the platinum catalyst volatilized at Pt02,1~ and redeposited on the 600 to 700 ~ walls of the quartz liner tube at the furnace downstream end (Figure 1). This rendered the tube surface catalytic and SO3/SO2 ratios corresponding to 600 to 700 ~ equilibrium were found in analysis, rather than those corresponding to the actual temperature of the Pt catalyst
(a)
Y:O3 (~.pure~+ SO3 ~g/ = sulfation product (s.pur~ [1] there is an equilibrium SO3 partial pressure, determined by AG ~ for the reaction at the given temperature, above which the sulfation product m a y form, but below which it can R. L. JONES is Head, High Temperature Chemistry Section, Chemistry Division, Naval Research Laboratory, Washington, DC 20375-5000. D. B. NORDMAN, Ensign, United States Navy, is presently on Fleet duty. S. T. GADOMSKI, Chemical Engineer, formerly with the Naval Research Laboratory, is now with Sachs/Freeman Associates, Inc., Bowie, MD. Manuscript submitted January 23, 1984. METALLURGICALTRANSACTIONS A
(b) Fig. 1 - - ( a ) SEM micrograph of deposits on downstream furnace tube wail. (b) X-ray map identifying the deposits as platinum.
U.S. GOVERNMENT WORK NOT PROTECTED BY U.S. COPYRIGHT
VOLUME 16A, FEBRUARY 1985- 303
and specimen boat. Thus SO3 and SOz could not be measured directly at 850 to 950 ~ It was necessary instead to assume that SO2-SO3 equilibrium was achieved over the specimen boat at the higher temperatures, and to calculate SO3 concentration from the measured total SOx and thermodynamic data. s The second problem was that several Y203 sulfation runs at 850 ~ (Figure 2) showed no weight gain, or little weight gain, although the SO3 pressure was above the apparent equilibrium value. These anomalies appear to result, however, from kinetic, and not thermodynamic, causes. For example, when the oxide specimen from the test marked A in Figure 2 was reexposed for another 24 hours, it yielded the weight gain data point marked B. Also, when specimens which had sulfated at SO3 pressures above equilibrium were reexposed at pressures below the apparent 15 x 10 6 atm equilibrium value, they lost weight, returning to zero weight gain at a rate dependent on how far the new SO3 pressure was below the equilibrium value.
Data Loading...