Superplastic behavior of a zn-22 pct ai-0.5 pct cu alloy
- PDF / 338,775 Bytes
- 3 Pages / 594 x 810 pts Page_size
- 52 Downloads / 345 Views
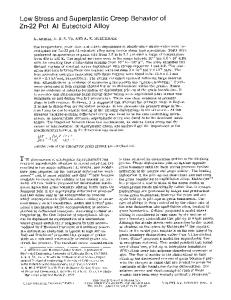
After failure, specimens were sectioned parallel to the tensile direction and polished to a 0.3/zm A1203 finish. Nital etching was used to reveal grain structure. The mean linear intercept grain size (actually average phase size) was measured. No measurements of grain aspect ratio or of individual phase size were obtained. Figure 1 shows the true flow stress as a function of the nominal strain rate, taken at a constant strain of about 0.3. This curve exhibits typical superplastic sigmoidal behavior. The strain rate sensitivity, m, has a peak value of 0.55 at intermediate strain rates, falling to about 0.21 at the lowest strain rate. Figure 2 shows the elongation to fracture, again as a function of the nominal strain rate. There is a broad maximum in the elongation, the center of which occurs at roughly the same strain rate as that at which the peak in strain sensitivity is found. It is also clear from the figure that the fracture elongation falls more rapidly with increasing strain rate than with decreasing strain rate. This is consistent with observations of the samples after testing. Deformation in the lower strain rate regime is very uniform--only diffuse necks are found. In contrast, samples tested at high strain rates exhibit sharp necks. Measurements of strain-enhanced grain growth in this alloy have been briefly reported previously.8 The results are discussed in detail here. We find that very little grain growth occurs during stress-free annealing or in the shoulder of the specimen while very considerable grain growth occurs under the influence of deformation. The results of quantitative measurements of grain size are shown in Figure 3. As
100
(ram-~)
J
~0:~
ld'3
10-2
10-1
LF" (s'q
Fig. 1- - T h e stress-strain rate curve, showing typical sigmoidal behavior, measured after a strain of about 0.3.
Zn 22AI 0.5C. T= 473K
2001
I%) 1000
io:'
lO:3
lO'2
lO'4
w'a
Fig. 2 - - T h e percent elongation to fracture as a function of the nominal strain rate. VOLUME 17A, OCTOBER I986-- 1873
5
I
I
Zn- 22%AI-O.5%Cu
4
I
do = 1.2 p,m T = 573K
1~ (s-I)
• 7 x=O-2
ZXd tern)
---&
3 -__._. .... o
_
2 ........ •
I
e" ..'""
""/
" ~ ;~o""
1.4 x I0-2 1.4x,0-3
~..;:~..";'~'~'--../
1.4xlO-
.~..:".~J
. :. - " 0 ~
3.2x 10⁻⁵ z~=,..7"~" ~
. . . . ~ 1.4xlo~;" 7
.-
;:)
1.0
/ .
~. ~
•
~"
.~.
~
........
i
!
2.0
3.0
,4.0
Fig. 3 - - G r a i n size increment as a function of true strain for samples tested at different nominal strain rates.
generally observed, the amount of grain growth per unit strain is largest at the smallest strain rates, even though the actual grain growth rate per unit time increases with increasing strain rate. A comparison of our results with those of Mohamed et al. (1977) on Cu-free Zn-22 pct A1 suggests that there is very little effect of copper addition on the flow stress of this material under superplastic testing conditions. This is consistent with the results of Naziri and Pearce. ~However, the other properties which we have measured, related to grain growth and
Data Loading...