Surface Features and Alteration Products of Natural Zirconolite Leached in Silica-Saturated Solutions
- PDF / 2,856,962 Bytes
- 8 Pages / 379.08 x 595.26 pts Page_size
- 66 Downloads / 256 Views
158
Table I. EMPA and SEM-EDS chemical analyses for zirconolite sample #B20392. The results reported in this study are the average of 12 EDS analyses. Errors are reported in parentheses and correspond to 2ar. End-member zirconolite composition is given for comparison. Values are reported in wt.%.
This study
Nb 20 5 3.56 (1.08)
TiO 2 33.59 (5.40)
ZrO2 24.37 (5.07)
ThO 2 21.13 (1.71)
U0 2 2.65 (0.80)
FeO 4.31 (1.29)
MgO 1.35 (0.84)
CaO 8.53 (0.33)
total 99.48
3.6
28.0
30.9
20.5
2.1
3.1
2.4
7.9
98.5
47.12
36.34
16.54
100
Sinclair and Ringwood (1981) CaZrTi2 0 7 RESULTS
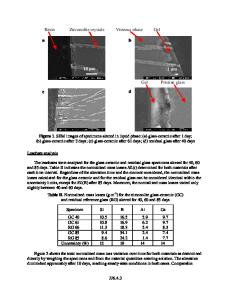
After leaching, the most notable surface features were the exposed, spherical micro-voids (Fig. 1). Contrast enhanced gray-scale analysis of digital images indicate approximately 4% porosity. These micro-voids are as large as a few pim in size, an observation consistent with previous results [3]. The micro-voids are plentiful and appear to be evenly distributed across the sample surface. The micro-voids not only increase the surface area of the sample, but also act as nucleation sites for alteration phase growth (Fig. 2). The main alteration phase found in the first leaching experiment was cheralite, nominally (Th, Ca, Ce)(P0 4, SiO 4), a monazite-structure type (Fig. 3). Quantitative EDS analyses are reported in Table II. The calculated weight percents are given for the end-member composition of cheralite for comparison. REE-monazite phases have been observed previously as alteration products in zirconolite leaching studies [14]. Cheralite crystals were observed inside the microvoids (Fig. 3 bottom). These small size of these crystals (most
Data Loading...