Surface Morphology of Gallium Phosphide Deposited by Chemical Beam Epitaxy and Interrupted Cycle Chemical Beam Epitaxy
- PDF / 1,120,861 Bytes
- 6 Pages / 414.72 x 648 pts Page_size
- 14 Downloads / 343 Views
L2 H2 on
M
TBP on
L
TEG on
pulse
height
F•'T1
7A I
S
...........
I
I
........
I
F
I
I
0
I
I
I FA m
|
Scycle
I
......
I
I
SI
I
I
I
....
I
I
I
I
time
I
m time
Figure 1 a
0
•
cycle time
Figure 1 b pulse height
."./'
I
I
I
I
I
I
M
I
I
I
I
I
time Figure 1c
0
I
I
I
I
i
time
cycle time Figure 1d Figure la-d: The pulse height of TEG is 1/25 of the pulse height for TBP. The TBP on duration is twice the TEG on duration. The pause duration between on times is equal to the TBP on duration. The TBP, pause and TEG duration times are proportional to the cycle time. Table 2 cycles times were for 1.4 seconds which produces the smoothest film without the addition of hydrogen. 0
4
598
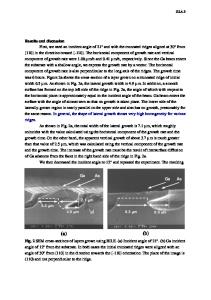
To add information concerning the chemical behavior of the whiskers, wet etching experiments were carried out using buffered oxide etch, HCl and H 2 SO 4 , followed by imaging of the resulting changes in the surface features by AFM. RESULTS Thin films of GaP deposited by the CBE system for 60 minutes resulted in a 62.5 nm film with 70-80 nm long whiskers protruding above the film surface as determined by AFM. Thicker films of 200 nm of GaP do not reveal whiskers, but the rms surface roughness is still substantial, that is 7.5 nm. Addition of hydrogen does not remove the formation of whiskers, but generally reduces the rms surface roughness. Table 1 shows the cycle time, number of cycles, film thickness, whisker protrusion and rms surface roughness for ICCBE process without hydrogen. The smoothest film with the smallest whisker protrusions were obtained for a cycle time of 1.4 seconds. Figures 2a and 2b show lOt AFM line scans of the surface of GaP films grown by ICCBE with and without hydrogen, respectively. Whiskers are observed in the ICCBE GaP film without hydrogen with a rms surface roughness of 6 nm. Admission of a continuous beam of hydrogen to the surface during heat up and growth enhances the growth rate at flow rates < 0.5 sccm. However, high flow rates (_>1 sccm) of hydrogen reduce the growth rate. TABLE 1 Cycle time, thickness and surface rms for ICCBE operation Cycle time seconds 0.7 1.4 3.5 7.0
# cycles
Thickness nm
5000 2500 1000 500
95 75 38 39
Whisker protrusion nm 76-108 27-42 86-102 129-182
surface rms nm 8.4 6.0 14 42
For ICCBE, three conditions of hydrogen flow were established as illustrated in Figs lb-d and the results are shown in Table 2. If hydrogen is injected only during TBP pulse (Fig lb), whiskers of larger height and a larger rms surface roughness are observed than under the conditions of CBE growth with and without hydrogen flow. If the hydrogen is injected only during the TEG pulses (Fig 1c), both the height of the whiskers and the rms surface roughness are cut in half as compared to the conditions of Fig lb. For continuous hydrogen flow the formation of whiskers are eliminated and the rms surface roughness decreases. The lowest roughness is observed at high hydrogen flow rate, that is, 1.4 nm at 1 sccm hydrogen flow as shown in figure 2b. While
Data Loading...