Temperature Distribution in InGaN-MQW LEDs under Operation
- PDF / 188,661 Bytes
- 6 Pages / 612 x 792 pts (letter) Page_size
- 71 Downloads / 284 Views
.18
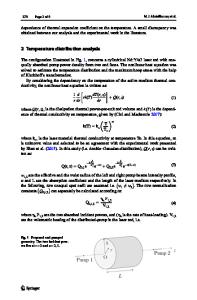
Temperature (K) 350 340 330 320
310
300
290
280
Output Power (a.u.)
InGaN-MQW-LED operated on a temperature controlled heat sink
P=2.4355*exp{0.049eV/kT}
2.8
3.0
3.2
3.4
3.6
Reciprocal temperature (1000K/T)
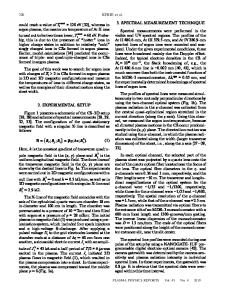
Figure 1: Temperature dependence of output power showing the almost exponential decrease of light output with increased temperature. efficiency is depending almost exponentially on temperature according to equation (1) approximated for higher temperatures. −1 τ t pN t Et − E r ηi = 1 + ( (1) ) exp( − ) τ r nN r k BT with η i , τ i , n , p , N i , Ei being the internal quantum efficiency, the lifetime, hole and electron concentration, concentrations and energies of radiative and non-radiative recombination mechanisms. The indices t and r account for trap and radiative related transitions. The temperature of a LED can be derived from the emission spectrum with a fit using several fitting parameters [2], it is also possible to exploit only the short wavelength slope near the maximum of the EL spectrum for temperature determination according to reference [3]. Full fits on µ-EL spectra are applied to get a spatially resolved picture of the temperature distribution. The backside emission of a LED was therefore spectrally and spatially mapped through the sapphire substrate. Figure 2 shows the integral EL intensity and wavelength distribution of a LED driven with a current density of 91 A/cm². The elevated current density beneath the p-contact is reflected by an increased temperature. A heat drain effect by the bondwire can be seen in a reduced redshift. Details are published in [4]. Temperature determination with Raman measurements makes use of the phonon shift. From the relative shift of the GaN E2-phonon frequency of a LED under operational current with respect to the frequency at zero current, the temperature of the device can be
F99W11.18
Figure 2. Temperature distribution derived at different points from µ-EL (current density j=320 A/cm²), the redshift beneath the p-contact is due to increased temperature resulting from higher current density, the reduced redshift beneath the bond wire is due to heat drain effect. For an extended discussion of measuring method and results cf. [4] computed. A detailed description of this measurement method is given in reference [5]. A spot diameter of 0.7 µm permits high spatial resolution. Results of Raman measurements are depicted in Figure 3 in comparison with data obtained from high energy slope fits of EL spectra. In good agreement, both methods reveal temperatures of about 415 K already at moderate currents of 30 mA. 500 Telectroluminescence TRaman
Temperature (K)
450
400
350
300
250
0
5
10
15
20
25
30
Current (mA)
Figure 3. Temperature of LEDs under operation, LEDs mounted on teflon heat sink. Comparison of temperatures derived from EL and Raman measurements. In good agreement, both methods yield temperatures as high as 415 K even at moderate currents of 30 mA.
F99W11.18
SIMULATION The finite element calculations for temp
Data Loading...