The Cubic to Hexagonal Phase Transition in Spray Deposited Tin-Doped Indium Oxide Films
- PDF / 344,615 Bytes
- 6 Pages / 414.72 x 648 pts Page_size
- 59 Downloads / 370 Views
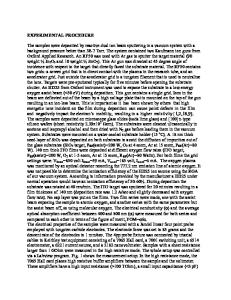
controller (4) through thermocouple (5). Prior was to deposition, substrate's temperature was maintained at 470 "Ca within +1 "C. Deposition carried out the by introducing the solution into the receptacle (6) of a special designed glass atomiser (7) with a carrier gas output nozzle of 0.5 mm diameter and a solution output nozzle of 0.3 mm diameter. The solution was prepared using InC13 and SnCI45H20 precursors (27:1) dissolved in methanol up to concentrations of 0.7 M. Acetic acid was added to increase the clarity of starting solution by dissolving the precipitates.
compressed air 3••51
[
solution
..
4
hot ,oto
!
]
I
Figure i -Schematic diagram of the spray process. The deposition process was carried out at atmospheric pressure using compressed air (about 0.5 kgf cm2) as carrier gas for spraying the solution (6) onto substrate surface. The process was performed by repeating the spraying on periods of 5 s, followed by short off periods, to avoid excessive cooling of the hot substrate during the spraying. A homogeneous film was provided by moving the atomiser. A small silicon polished plate placed near substrates was used to monitor film's thickness during the deposition process by observing the corresponding interference fringe's colour. Characterisation tools Films' thicknesses were measured by Sloan Dektak IIA profilometer. The X-ray diffraction patterns were recorded on a PWI710 diffractometer with a Cu rotating anode, equipped with a monochromator. Atomic concentrations of various elements in ITO films were determined by X-ray photoelectron spectroscopy (XPS) analysis. Linear background subtraction and Gaussian peak deconvolution of all peaks were performed using VGS 5250 software. Atomic concentrations were computed from measured peak areas (O Is, Sn 3d5, In 3d5, CI 2p ) using the following sensitivity factors: O, 2.85; Sn, 14.63; In, 13.23; CI, 2.36. Optical transmittance spectra in the wavelength range from 0.3 to 2.5 •tm were obtained using a Shimadzu double-beam UV-VIS-NIR spectrophotometer. Van der Pauw's technique was used to measure electrical resistivity and Hall coefficients of fihns, using a cryostat specially designed (HL5500PC - Biorad Microscience). RESULTS X-ray diffraction investigation. Figure 2 shows the X-ray diffraction patterns of as-deposited ITO films prepared in the same technological conditions but with two different thicknesses (I 00 and 400 nm).
600
250 0 L'
,
,
. a- d = 100 nm
b
( nm b- d = 400
2000
•
o 1500
S1000
a
0@)
500 0
20
30
40
50
7
60
20 (degree) Figure 2 -X-ray diffraction patterns of as-deposited ITO films with different thicknesses. X-ray diffraction analysis revealed that all as-deposited ITO film were polycrystalline in nature. A comparison with the JCPDS In 20 3 powder data file (No. 6-0416) [5] shows clearly the cubic structure of thin (100 nm thick) ITO films (curve a in Fig. 2) with a preferential index peaks orientation perpendicular to substrate plane. This is in agreement with X-ray data of ITO films produced by various deposition tec
Data Loading...