The effect of alkali salt catalyst on the carbothermic reduction of nickel oxide
- PDF / 194,514 Bytes
- 2 Pages / 603.28 x 783.28 pts Page_size
- 23 Downloads / 326 Views
Table I. C o n d i t i o n s o f E x p e r i m e n t a l Runs without Catalyst Added
Row-rate of Ar C grain size NiO grain size C/NiO molar ratio Weight of solid sample
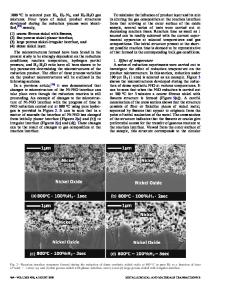
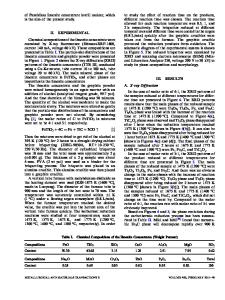
The Effect of Alkali Salt Catalyst on the Carbothermic Reduction of Nickel Oxide C.I. LIN The purpose of this communication is to report the experimental measurements on the rate of carbothermic reduction of nickel oxide with and without catalyst added. While kinetic studies on the molten salt enhanced carbothermic reduction of iron oxides []'2] and zinc oxide I31 have been reported, no report has been found on the kinetics of carbothermic reduction of nickel oxide with catalyst added. In the present work, the reaction was carried out in a thermogravimetry analysis system (TGA) and the exit gas was analyzed by a gas chromatograph (GC). Powders of NiO, graphite and/or salt, Li2CO3, or eutectic mixture of NazCO3, and K2CO3 were fully mixed and packed in an alumina crucible. The solid sample was raised up to a cold upper position when the reaction tube was heated up. When the temperature reached the desired value, the sample was dropped down to the hot zone for reaction. The weight of the solid sample was continuously weighed and recorded. Argon, 200 cc/min, was used to carry product gases, CO and CO2, out of TGA for composition analysis. The NiO powder with 77.6 pet assay as Ni, less than 200 mesh, was provided by J. T. Baker Chemical Company. The graphite powder of ultra "F" purity, 100 mesh, was supplied by Ultra Carbon Corporation. Li2CO3 of Fisher Scientific Company with 99.4 pet purity was employed. The eutectic salt was prepared from Na2CO 3 and K2CO3 of Mallinckrodt, Inc. and E. M. Science, Inc., respectively. Four experimental runs have been carried out for the reaction without catalyst added. The experimental conditions are listed in Table I and the weight loss curves are shown in Figure 1. Two runs performed at 800 ~ show that the results are reproducible to within 10 pet. There are three periods in each run: an induction period, a growth period, and a decline period. A higher reaction temperature reduces the length of the induction period and accelerates the reaction rate in the growth period. An activation energy of 90 kJ/mol was calculated from the plot of the reaction rate in the growth period with reciprocal temperature (Figure 2). The gas compositions determined at Aw -- 0.41 g for different reaction temperatures are listed in Table II. Though the product gas is predominantly CO2 at all temperatures tested, the concentration of CO increases as the reaction temperature is increased. For the liberation of COz, half an atom of carbon is associated with an atom of oxygen while for the case of CO, one atom of carbon is needed. Therefore, when the CO concentration increases a corresponding increase in weight loss is also detected, as C.I. LIN, formerly with the Department of Metallurgical Engineering, The Ohio State University, Columbus, OH, is with the Department of Chemical Engineering, National Taiwan Institute of Technology, Taipei, Ta
Data Loading...