The Phonon Densities of States of AlN and ZrN
- PDF / 273,012 Bytes
- 6 Pages / 414.72 x 648 pts Page_size
- 98 Downloads / 322 Views
Mat. Res. Soc. Symp. Proc. Vol. 395 01996 Materials Research Society
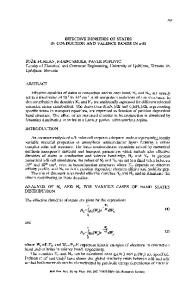
observed, indicating the presence of a small amount (< 5%) of impurities. Fig. 1 displays a part of the observed and fitted powder-diffraction pattern of AIN. Such low level of impurity is not expected to affect the measured phonon DOS of the major phase.
AIN powder
cj
298 K 1
1-4
0
U 0
S......................... il|iliHIl|llllll IIIlillllll I II I
I
I
I
II I
I
I
0.5
tI I
I
I•
2.0
1.5
1.0
2.5
d spacing (A) Figure 1. Rietveld profile fit in the 0.8-1.8 A region of d-spacing for the AIN powder at room temperature. The symbols are the observed, background subtracted intensities. The solid line represents the calculated crystalline intensities. The tick marks indicate the positions of the Bragg reflections. The difference between the observed and calculated intensities is shown at the bottom of the figure. The inelastic experiments for phonon DOS measurements were carried out using the Lowand High-Resolution Medium-Energy Chopper Spectrometers (LRMECS and HRMECS), also at IPNS. Incident neutron energies (E0) of 150, 200, 400, and 800 meV were used to study the phonon excitation spectra at 15-300 K over a wide range of energy transfers. The energy resolution AE (full width at half-maximum) of HRMECS (LRMECS) varies from -4% (-8%) of E 0 in the elastic region to -2% (-4%) near the end of the neutron energy-loss spectrum. Under the incoherent approximation, the low-temperature neutron excitation spectrum of a powder sample averaged over a wide range of detector angles provides a direct measure of the generalized one-phonon density of states (DOS) which differs from the true phonon DOS by the weighting factors - (where c, (y,and m are the concentration, neutron-scattering cross section, and mass, respectively, of the constituent elements). Since the N scattering cross section (11.5 X 10⁻²⁴ cm 2 ) is significantly larger than those of Al (1.5 X 10⁻²⁴ cm 2 ) and Zr (6.6 X 10⁻²⁴ cm 2 ), the observed DOS are weighted more favorably to N. PHONON DENSITIES OF STATES Fig. 2 (a) displays the observed neutron-weighted phonon DOS of AIN from a run with an incident energy of 150 meV. This spectrum is dominated by one-phonon excitations which
424
shows a cut-off energy at about 120 meV. The broad features below 70 meV and the sharp band with two resolved peaks at higher energies reflect the distribution of three groups of optic modes around 32, 63 and 83-91 meV. The upper optic modes show little dispersion throughout the zone, which is typical to the wurtzite structure. The zone-center optic phonons have been investigated with Raman and infrared spectroscopy by many authors [4-10}. Rather significant discrepancies exist among the reported frequencies of the assigned Raman and IR active modes. Qualitatively, the Raman frequency groups around 31-37 meV (252-303 cm-1 ), 76-83 meV (614-668 cm-1), and 110-114 meV (888-916 cm- 1 ) are in good agreement with the neutron data. 200
150
"-
100
C0 50
0 CL
0 L 0
50
60
100
150
a)
S40 4a) Z
Data Loading...