Uniform Quantum Dots by Self-Organizing Process in Atomic Hydrogen-Assisted MBE
- PDF / 1,792,249 Bytes
- 5 Pages / 414.72 x 648 pts Page_size
- 94 Downloads / 250 Views
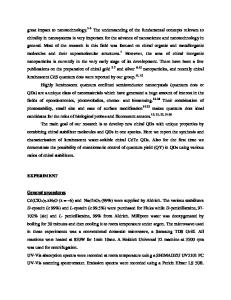
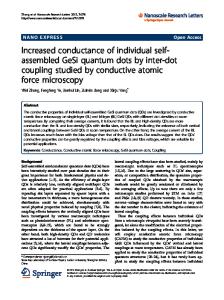
RESULTS The AFM observations of In(Ga)As ODs Fig. 1 (a) and (b) show the surface morphologies of InAs films of 4 ML grown at 350'C without-H and with-H, respectively. There are no particular differences in surface morphologies between without-H and with-H and the QDs size ranges from 10 nm to 70 nm. When the deposition increases to 5 ML, coalescence of QDs are occured. We have already confirmed that atomic H suppresses the surface diffusion of adatoms by terminating the growing surface. [1 1] At low temperature, therefore, it is expected that the migration length of adatoms is significant limited and then various size of QDs are formed.[12] Fig.2 (a) and (b) show the surface morphologies of InAs films of 2.5 ML at 5000C withoutH and with-H, respectively. The size fluctuation of QDs is dramatically reduced at both cases compare to that at low growth temperature. From top-view AFM observations, almost all QDs have spherical-shaped of approximately 30 nm in diameter. It indicates that enhancement of surface migration is necessary to obtain low fluctuation and uniform-shaped QDs. The surface morphologies of InO.8GaO.2As of 3.5 ML at 480C are shown in Fig.3 (a) without-H and (b) with-H, respectively. The average size of QDs is reduced to approximately 20 nm in with-H case while 40 nm of QDs are observed in without-H. There are also much differences in the distribution of QDs between both cases. The QDs are preferentially formed at step edges and arranged along the steps in without-H. The QDs observed in with-H case, however, do not have preferential sites and are distributed uniformly on growth surface. .00
t LIOU
M.so
0.0s
0.25
- 0 1-00
(a) (b) Fig. 1 The surface morphologies of InAs of 4 ML at 350°C are shown: (a) without-H and (b) with-H, respectively. The scan area is I j×14m. 1.00
1100
0.73
.0.7"
0.0
W
Fig. 2
ý
ý
ýO•t~
(a) (b) are shown: at 500°C ML of 2.5 of InAs The surface morphologies (a) without-H and (b) with-H, respectively. The scan area is lx I 4m. 290
-1.00
.00
•N
uN
0
Fig. 3
0.75
50
6,6 .2
0
1 IO
0.20
0175
0.50
1.00
(b) (a) The surface morphologies of InO.sGaO.2As of 3.5 ML at 480"C are shown: (a) without-H and (b) with-H, respectively. The scan area is lx I/pm.
The PL measurements of In(Ga)As ODs Fig.4 shows the 4 K PL spectra of InAs films of 2.5 ML grown at 500"C: (a) without-H and (b) with-H, respectively. The AFM images of the samples before cap layer deposition are shown in Fig.2. The PL peak energy related to InAs QDs is observed at 1.30 eV in both cases. The peak at 1.43 eV is also appeared in with-H. It is attributed to wetting layer formed by 2D growth during InAs deposition. In S-K model, when film thickness increases and exceeds a critical layer thickness (CLT) that lattice constant of epitaxial film starts to relax, growth mode changes to island growth. The film growth, however, proceeds two-dimensionally during first few ML less than CLT even in large lattice-mismatched system and then wetting layer is eventually formed. The InAs quantum well with nominal 1.5
Data Loading...