Assessment of high sensitivity C-reactive protein and coronary plaque characteristics by computed tomography in patients
- PDF / 1,730,445 Bytes
- 7 Pages / 595.276 x 790.866 pts Page_size
- 59 Downloads / 271 Views
RESEARCH ARTICLE
Open Access
Assessment of high sensitivity C-reactive protein and coronary plaque characteristics by computed tomography in patients with and without diabetes mellitus Hai-Ting Zhou†, De-Li Zhao†, Guo-Kun Wang, Tian-Zuo Wang, Hong-Wei Liang and Jin-Ling Zhang*
Abstract Background: To evaluate the coronary plaque characteristics of coronary arteries using computed tomography angiography (CTA) in order to assess the risk of coronary artery disease and the relevance of high sensitivity C reactive protein (hs-CRP) in patients with Diabetes Mellitus (DM). Methods: The clinical data of 400 DM patients and 400 non-DM patients from January 2017 to December 2019 were collected, including the results of coronaryCTA. The plasma hs-CRP level of the two groups were divided into three groups: CRP ≤ 1, 1 < CRP ≤ 2, CRP > 2. The correlation of the degree of stenosis, the number of plaques, the nature of plaques and hs-CRP value between the two groups was evaluated. Results: Compared with non-DM patients, the incidence of coronary artery plaques and lumen stenosis in DM patients was more higher than that in non-DM patients. DM patients were more likely to have more diseased vessels, especially diffuse vascular disease (12.00% vs 1.75%; P < 0.001). Subjects with high hs-CRP levels were more likely to have any plaque compared with individuals showing normal hs-CRP levels (p 75%), and 4) completely closed, narrow vascular lumen (100%). The classification of coronary plaques was based upon the Schroeder standard in CT value [9]: Non-calcified plaques: Negative 42–47 HU; mixed plaques 61–112 HU; calcified plaques 126–736 HU. The lowest CT value was selected from randomly chosen four or more sites in the area of interest (> 1.0 cm2) in the axis or CPR image (Figs. 1 and 2). Statistical analysis
All statistical analysis was conducted using SAS 9.3 software. The quantitative data followed the normal distribution by the mean and the standard deviation, but it deviated from normal distribution when the median and the upper and lower quartiles were used. For counting purposes, frequency and percentage values were measured and a Chi-squared test was used to compare between groups, while Fisher method was applied when
Zhou et al. BMC Cardiovascular Disorders
(2020) 20:435
Page 3 of 7
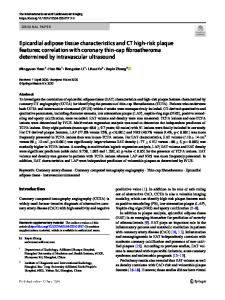
Fig. 1 Different types of coronary artery plaque. a is normal coronary artery, b is calcified plaque, c is mixed plaque and d is non-calcified plaque. As shown by the arrow in the figure
criteria for Chi-squared test were not met. For leveling purposes, frequency and percentage values were measured and Wilcoxon rank-sum test was used to compare groups. When p < 0.05, a statistically significant difference was inferre. Kappa test was used to assess the consistency between the two radiologists’ readings.
or ARB and calcium channel blockers had no significant difference. The serum level of hs-CRP in DM group was significantly higher than that in non DM group [1.785 (0.88–4.71) mg/L vs. 1.08 (0.53–2.7) mg/L, p < 0.05]. Table 1 summarizes the
Data Loading...