Characteristics of Deep Centers Observed in n-GaN Grown by Reactive Molecular Beam Epitaxy
- PDF / 93,284 Bytes
- 6 Pages / 612 x 792 pts (letter) Page_size
- 36 Downloads / 335 Views
F99W11.84
window (0.8 s-1) in our DLTS system was used. To determine the parameters of the deep-centers, i.e. the activation energy ET and capture cross section σT, the DLTS spectra were taken at different rate windows, from 0.8 to 200 s-1. To study the unusual capture kinetics of C1, DLTS spectra were measured, at a fixed bias (-2.0 V) and a fixed filling pulse height (+0.5 V), by varying the filling pulse width from 0.2 up to 100 ms. RESULTS AND DISCUSSION The profiles of the electron concentrations for four SBD samples, obtained from 300-K C-V measurements, are basically flat as shown in figure 1. (The earlier rise observed in the concentration of sample 5964 is evidently due to a smaller n-GaN thickness above the n+-GaN layer). An interesting observation is that the electron concentration in the n-GaN layers seems to depend on the AFR; i.e., the lower AFRs for samples 5962 and 5963 result in higher electron concentrations, as compared to those for samples 5961 and 5964. The DLTS spectra for three samples, 5963, 5961, and 5964, with n-GaN layers grown by using AFRs of 20, 60, and 73 sccm, respectively, are shown in figure 2a, and a DLTS spectral comparison for samples 5962 (20 sccm) and 5961 (60 sccm) is shown in figure 2b. From the DLTS spectra of the figures, we can observe seven deep centers, labeled as A1, A, B, C1, C, D, and E1. A1, with concentrations of mid-1015 to low-1016 cm-3, is a dominant center in RMBE-GaN layers, while C1,with concentrations in the 1015-cm-3 range, is also a prominent center in the layers. Two interesting observations are: 1) the peak positions of A1 and, especially, C1 are found to be sample-dependent: i.e. their peak positions shift to lower temperatures as the electron concentrations in the samples increase; and 2) D, with concentrations in the 1014-cm-3 range, is clearly observed in samples 5961 and 5964, grown using higher AFRs, while E1, with concentrations also in the 1014-cm-3 range, is only observed in samples 5962 and 5963, grown using lower AFRs (see figure 2b for a detailed comparison). The Arrhenius plots of T2/en for all the deep centers are presented in figure 3. To understand the possible defect nature of E1, the Arrhenius plot for the electron-irradiation (EI) induced trap E in n-GaN grown by MOCVD [7] is also presented in the figure. A1, with an average ET=0.89 eV and σT=3 x 10-14 cm2, has an energy close to that of A1 A
10
E1 in 5962 EI-induced E
5
10
B
4
2
5961 (60 sccm) 5962 (20 sccm) 5963 (20 sccm) 5964 (73 sccm)
10
2
100
T /en (K s)
Electron concentration (10
16
-3
cm )
6
10 T= 300 K Vb(max)= -6.0 V
10
C1
C D
E1 E
3
2
10
1
10 0.1
0.2
0.3
0.4
2
3
4
5
6
7
8
9
10
1000/T (1/K)
Depth (µm)
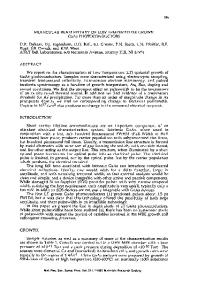
Figure 1. Profiles of electron concentrations for four SBD samples (note the dependence of the electron concentration on AFR).
Figure 3. Arrhenius plots of T2/en for all seven deep centers; also presented is the plot of EI induced trap E in n-GaN grown by MOCVD.
F99W11.84
1.5
DLTS signal (10
16
-3
cm )
5964 (73 sccm) 5963 (20 scc
Data Loading...